Geography Reference
In-Depth Information
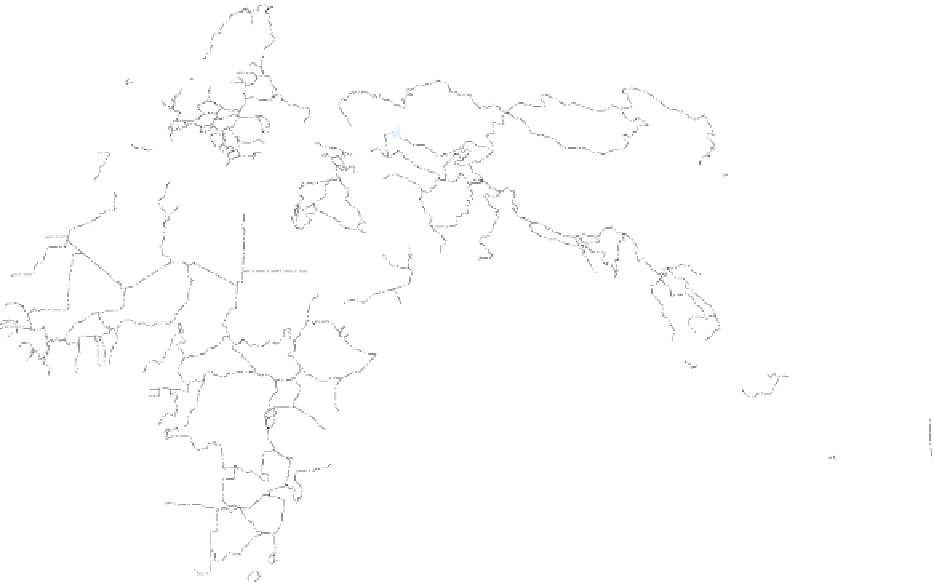
GREENLAND
Arctic Circle
FINLAND
ICELAND
NORWAY
RUSSIA
ESTONIA
LITHUANIA
60°
60°
SWEDEN
LATVIA
UNITED KINGDOM
DENMARK
NETH.
IRELAND
POLAND
BELARUS
UKRAINE
GER.
MOLDOVA
ATLANTIC
BELG.
KAZAKSTAN
AUS.
SWITZ.
HUNG.
MONGOLIA
FRANCE
ROM.
BULG.
OCEAN
GEORGIA
ARMENIA
AZERBAIJAN
N.
KOREA
S.
KOREA
KYRGYZSTAN
TAJIKISTAN
SPAIN
UZBEKISTAN
PORTUGAL
40°
ITALY
40°
JAPAN
TURKEY
TURKMENISTAN
GREECE
ALB.
CHINA
SYRIA
TUNISIA
CYPRUS
AFGHANISTAN
IRAN
PACIFIC
IRAQ
LEBANON
MOROCCO
JORDAN
BHUTAN
ISRAEL
PAKISTAN
NEPAL
ALGERIA
KUWAIT
LIBYA
BAHRAIN
WESTERN
SAHARA
EGYPT
QATAR
BANGLADESH
TAIWAN
Tropic of Cancer
U.A.E.
SAUDI
ARABIA
MYNAMAR
(BURMA)
20°
INDIA
MAURITANIA
LAOS
OMAN
MALI
OCEAN
NIGER
SUDAN
VIETNAM
THAILAND
CAMBODIA
CHAD
YEMEN
SEN
E
GAL
GAMBIA
GUINEA-BISSAU
GUINEA
SIERRA LEONE
LIBERIA
ERITREA
PHILIPPINES
BURKINA
FASO
DJIBOUTI
NIGERIA
SRI LANKA
IVORY
COAST
CENTRAL
AFRICAN REP.
SOUTH
SUDAN
ETHIOPIA
BRUNEI
CAMEROON
SOMALIA
INDIAN
TOGO
BENIN
MALAYSIA
GHANA
UGANDA
KENYA
Equator
CONGO
0°
RWANDA
SINGAPORE
GABON
EQUATORIAL
GUINEA
DEM. REP.
CONGO
OCEAN
BURUNDI
PAPUA
NEW
GUINEA
I
NDONESI
A
TANZANIA
EAST TIMOR
COMOROS
ATLANTIC
ANGOLA
ZAMBIA
MALAWI
MOÇAMBIQUE
FIJI
VANUATU
MADAGASCAR
ZIMBABWE
BOTSWANA
20°
20°
20°
20°
20°
NAMIBIA
MAURITIUS
NEW
CALEDONIA
Tropic of Capricorn
AUSTRALIA
OCEAN
SWAZILAND
SOUTH
AFRICA
LESOTHO
NEW
ZEALAND
40°
40°
40°
0°
20°
40°
60°
100°
120°
140°
160°
60°
60°
60°
60°
OCEAN
SOUTHERN
Antarctic Circle
understand why wealth is distributed unevenly, we can-
not simply study each country, its resources, and its pro-
duction of goods. Rather, we need to understand where
countries fi t in the world economy. That is, we need to
see the big picture.
Think of a pointillist painting. Specifi cally, envi-
sion the magnifi cent work of nineteenth-century French
painter Georges Pierre Seurat,
Sunday Afternoon on the
Island of La Grande Jatte
(Fig. 8.9). The painting hangs in
the Art Institute of Chicago. If you have the opportunity to
see the painting and if you stand close enough, you will see
Seurat's post-Impressionist method of painting millions
of points or dots—single, tiny brush strokes, each a single
color. When you step back again, you can gain a sense of
how each dot fi ts into the picture as a whole.
1
In the last
few decades, social scientists have sought to understand
how each dot, how each country and each locality, fi t into
the picture of the world as a whole. To study a single dot
or even each dot one at a time, we miss the whole. Even if
we study every single dot and add them together, we still
miss the whole. We need to step back and see the whole,
as well as the individual dots, studying how one affects the
other. By now, this should sound familiar: it is one of the
ways geographers think about
scale
.
1
We must give credit to former student Kelsey Lynd, who came up with
this metaphor for world-systems theory in a political geography class at
the University of Mary Washington in 1999.