Geography Reference
In-Depth Information
GREENLAND
U.S.
(Alaska)
60°
CANADA
40°
40°
UNITED STATES
ATLANTIC
BERMUDA
OCEAN
BAHAMAS
MEXICO
Tropic of Cancer
CUBA
DOMINICAN
REPUBLIC
PUERTO
RICO
20°
20°
20°
JAMAICA
U.S.
(Hawaii)
BELIZE
HAITI
HONDURAS
NICARAGUA
GUATEMALA
BARBADOS
TRINIDAD & TOBAGO
EL SALVADOR
PACIFIC
COSTA RICA
PANAMA
VENEZUELA
COLOMBIA
SURINAME
FRENCH GUIANA
GUYANA
0°
Equator
ECUADOR
OCEAN
PERU
BRAZIL
WORLD HUNGER 2011
PERCENTAGE OF UNDERNOURISHED
POPULATION BY COUNTRY
BOLIVIA
20°
20°
20°
PARAGUAY
Tropic of Capricorn
35% or greater
ARGENTINA
20-34%
CHILE
URUGUAY
10-19%
40°
40°
40°
40°
5-9%
4% or less
160°
140°
120°
80°
60°
40°
60°
60°
60°
60°
Data not available
SOUTHERN
OCEAN
0
1000
2000
3000 Kilometers
0
1000
2000 Miles
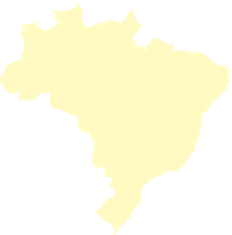
Figure 1.2
World Food Program Hunger Map, 2011.
Classifi cations designate the proportion of
the population malnourished. The World Food Program estimates just under 1 billion people
worldwide are malnourished.
Courtesy of:
United Nations World Food Program 2011.
On its face, such a huge problem might seem easy to solve. Take the total
annual food production in the world, divide it by the world's population, and
we have plenty of food for everyone. Yet, one-seventh of the world's popula-
tion is seriously malnourished. The vast majority of the 1 billion malnourished
people on Earth are women and children, who have little money and even less
power.
Figure 1.2 shows how food consumption is currently distributed-unevenly.
Comparing Figure 1.2 with Figure 1.3 shows that the wealthier countries also are the
best fed and that Subsaharan Africa (the part of Africa south of the Sahara Desert)


