Geography Reference
In-Depth Information
Residential Segregation
Racism has affected the distribution of African Ameri-
cans, American Indians, and others throughout the
history of the United States. During the past century,
some of the most dramatic geographic impacts of racism
could be found at the neighborhood scale. Historically,
states, cities, and towns passed laws that promoted resi-
dential segregation by disallowing the migration of cer-
tain racial groups into particular neighborhoods. Laws
passed during and after the civil rights movement of the
1960s in the United States made it illegal to legislate
residential segregation. Despite these changes, many
cities in the United States remain strongly segregated
along racial lines.
Geographers Douglas Massey and Nancy Denton
defi ned
residential segregation
as the “degree to which
two or more groups live separately from one another, in
different parts of the urban environment.” Massey and
Denton defi ned different kinds of residential segregation
in a 1988 article, explaining that residential segregation is
complex because:
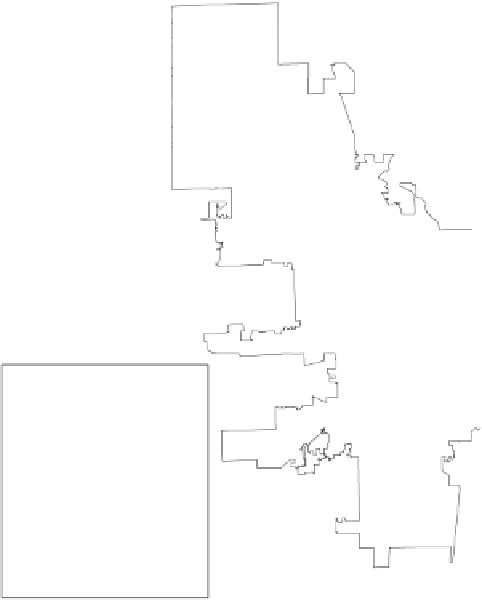
MILWAUKEE, WI
Lake
Michigan
0
2.5
5 Kilometers
0
2.5
5 Miles
AFRICAN AMERICAN
SEGREGATION BY
CENSUS TRACT
Over 80 percent
61 to 80 percent
31 to 60 percent
6 to 30 percent
Less than 6 percent
groups may live apart from one another and be “segre-
gated” in a variety of ways. Minority members may be
distributed so that they are overrepresented in some areas
and underrepresented in others, varying on the charac-
teristic of
evenness.
They may be distributed so that their
exposure
to majority members is limited by virtue of
rarely sharing a neighborhood with them. They may be
spatially
concentrated
within a very small area, occu-
pying less physical space than majority members. They
may be spatially
centralized,
congregating around the
urban core, and occupying a more central location than
the majority. Finally, areas of minority settlement may be
tightly
clustered
to form one large contiguous enclave, or
be scattered widely around the urban area.
Figure 5.5
Residential Segregation of African Americans in Milwaukee,
Wisconsin.
Percent African American by census tract.
Data from: United States Census Bureau, 2010.
The researchers reported that all fi ve measures
showed a decrease in residential segregation for African
Americans between 1980 and 1990 and another such
decrease between 1990 and 2000. A report after the 2010
census found that residential segregation for African
Americans peaked in the 1960s and 1970s and declined
again between 2000 and 2010. Between 2000 and 2010,
residential segregation did increase in fewer than 10 of
102 metropolitan areas with populations of 500,000 or
more. In 2010, the most residentially segregated large
metropolitan area for African Americans was Milwaukee,
Wisconsin (Fig. 5.5).
In 2000, when using an average of all fi ve measures
of segregation, the most residentially segregated met-
ropolitan area for American Indians and Alaska Natives
was Phoenix-Mesa, Arizona, and the least residentially
segregated is Oklahoma City. In 2000, the four least resi-
dentially segregated metropolitan areas (with at least 3
percent of the population American Indian) were all in
Oklahoma.
Grouping Asians, Native Hawaiians, and Pacific
Islanders, researchers of the 2000 report found 30
A special report issued by the United States Census
Bureau in 2002 statistically analyzed, charted, and mapped
residential segregation in metropolitan areas of the coun-
try, using the following fi ve statistical measurements of
segregation: evenness, exposure, concentrated, central-
ized, and clustered. These fi ve measurements directly cor-
respond to the fi ve types of segregation outlined by Massey
and Denton.
In the 2002 Census Bureau report, the authors
reported on the levels of residential segregation in metro-
politan areas of the United States between 1980 and 2000.
They found that overall residential segregation by race/
ethnicity is on the decline. For each of the four identities
they researched—American Indians and Alaska Natives;
Asians, Native Hawaiians, and Pacifi c Islanders; Black/
African Americans; and Hispanics/Latinos—they calcu-
lated fi ve statistical measures of residential segregation.
1


