Hardware Reference
In-Depth Information
50
Sensors
NewCategories
10
5
Mobile Devices
Controllers
Mobile PC
EquippedDevices
1
0.5
Server/PC
0.
01
0.1
0.5
1
5
10
50
100
DGIPS
*) DGIPS: Dhrystone GIPS
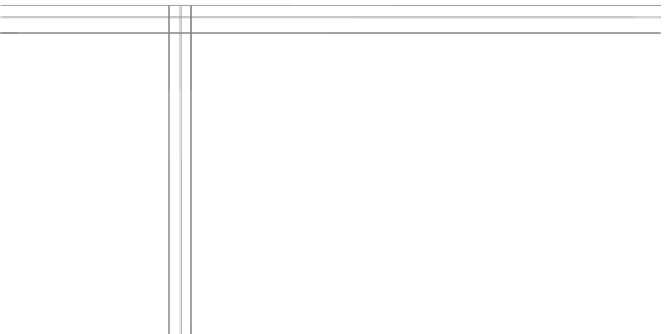
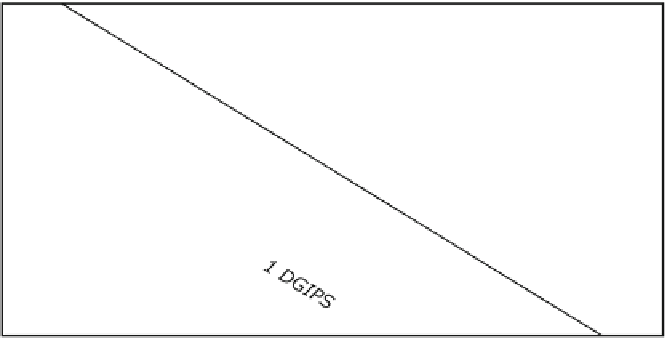
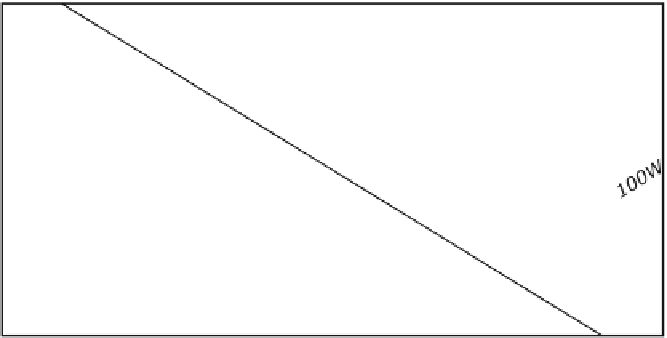
Fig. 4.1
Power budgets of chips for various application categories
The power of chips in the server/PC category is limited at around 100 W, and the
chips above the 100-W oblique line must be used. Similarly, the chips roughly above
the 10- or 1-W oblique line must be used for equipped devices/mobile PCs, or control-
lers/mobile devices, respectively. Further, some sensors must use the chips above
the 0.1-W oblique line, and new categories may grow from this region. Consequently,
we must develop high DGIPS
2
/W chips to achieve high performance under the
power limitations.
Figure
4.2
maps various processors on a graph, whose horizontal and vertical
axes, respectively, represent operating frequency (MHz) and power frequency ratio
(MHz/W) in logarithmic scale. Figure
4.2
uses MHz or GHz instead of the DGIPS of
Fig.
4.1
. This is because few DGIPS of the server/PC processors are disclosed. Some
power values include leak current, whereas the others do not; some are under the
worst conditions, while the others are not. Although the MHz value does not directly
represent the performance, and the power measurement conditions are not identical,
they roughly represent the order of performance and power. The triangles and circles
represent embedded and server/PC processors, respectively. The dark gray, light
gray, and white plots represent the periods up to 1998, after 2003, and in between,
respectively. The GHz
2
/W improved roughly ten times from 1998 to 2003, but only
three times from 2003 to 2008. The enhancement of single cores is apparently slow-
ing down. Instead, the processor chips now typically adopt a multicore architecture.
Figure
4.3
summarizes the multicore chips presented at the International Solid-
State Circuit Conference (ISSCC) from 2005 to 2008. All the processor chips pre-
sented at ISSCC since 2005 have been multicore ones. The axes are similar to
Fig.
4.2
, although the horizontal axis reflects the number of cores. Each plot at the
start and end points of an arrow represents single core and multicore, respectively.
The performance of multicore chips has continued to improve which has com-
pensated for the slowdown in the performance gains of single cores in both the


Search WWH ::

Custom Search