Biology Reference
In-Depth Information
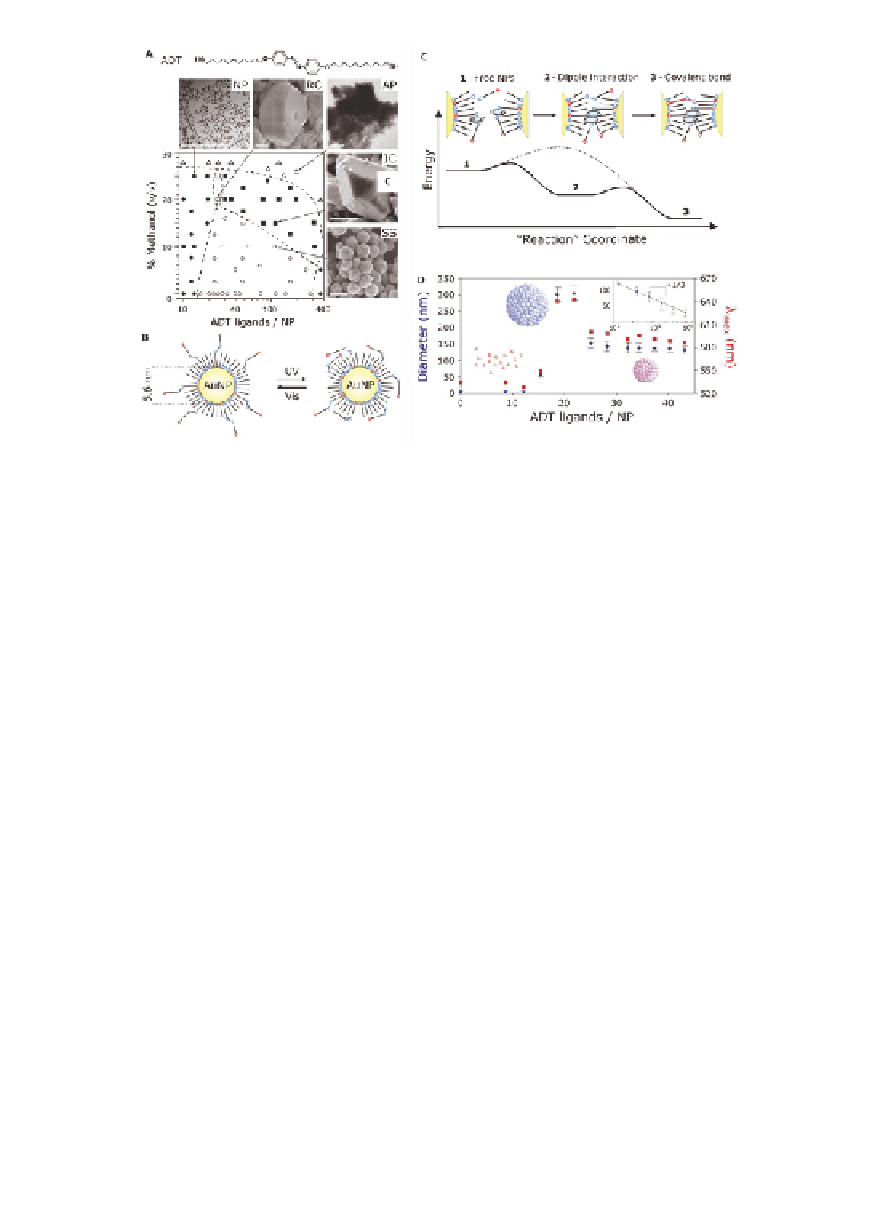
Figure 13.6
(A) Phase diagram of light-induced formation of nanocrystal
assembly. Phase diagram showing various types of
suprastructures with different numbers of ADT ligands
adsorbed onto each nanocrystal (NC) and for different
concentrations of methanol in methanol/toluene mixtures.
Each point corresponds to a separate experiment. NP,
unaggregated NPs; RC, photo-responsive crystals; AP,
amorphous precipitate; IC, irreversibly photo-responsive
crystals; SS, superparticles. Scale bars: 100 nm. (B) the
azobenzene groups of ADT ligands can be toggled between
trans-
-conformations by using UV and visible light,
respectively. (C) Proposed mechanism for light-induced
dipoles of
and
cis
-ADT ligands that mediate nanocrystal self-
assembly. (D) The diameter of the resulting superparticles as
a function of the number of ADT ligands on each nanocrystal
building blocks. (Inset) Superparticle diameter decreases
with increasing ADT concentration as
cis
D
∼
−
1/3
(
C
/
C
)
.
ADT
NC
From Ref. [36] with permission.
Moreover, this light-induced synthesis allows for control over the
final size of superparticles by varying the concentration of ADT.
22,36
A
higher concentration of ADT resulted in smaller gold superparticles
and vice versa. The size-control effect is also consistent with the
prediction of Eq. 13.10. A higher concentration of ADT leads to a
faster formation of active species (i.e., cis-ADT functionalized gold
particles), while the ADT concentration should not affect the growth
rate of superparticles because superparticle growth is determined

Search WWH ::

Custom Search