Biology Reference
In-Depth Information
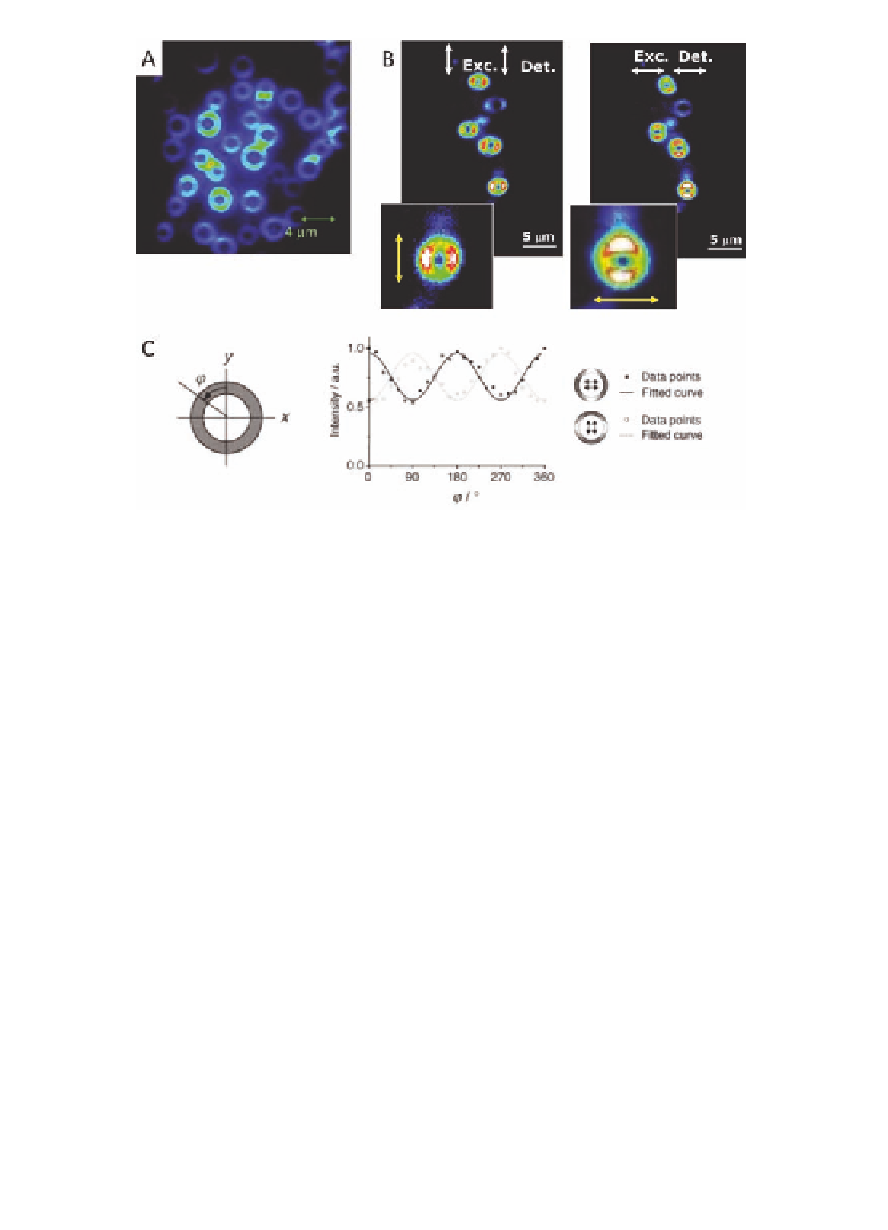
Figure 8.4
(A) Confocal fluorescence microscopy image of rings formed
by
on hydrophilic carbon-coated glass. (B) Polarized
fluorescence microscopy images; the arrows indicate the
excitation
2
and
detection
polarization.
(C)
Normalized
fluorescence intensity as a function of the angle
through the
rings. The solid points in the graph represent the fluorescence
intensity at different positions in the ring as measured with
horizontal excitation and detection polarization. The solid
lines are curves fitted to the solid data points by a cosine
function with a period of 180
f
. The open points represent
the fluorescence intensity at different positions in the ring as
measured with vertical excitation and detection polarization.
The dashed lines are curves fitted to the open data points by
a cosine function with a period of 180
°
. Copyright Wiley-VCH
Verlag GmbH & Co. KGaA. Reproduced with permission.
°
molecules of
must have a preferential orientation within the ring,
and the fact that the polarized fluorescence effects are expressed
in the micrometre size range indicates that this ordering must be
quite significant. It is proposed that when the excitation direction
is horizontal with respect to the ring, preferentially the porphyrin
hexamers at the top and the bottom of the ring are excited because
their transition dipole is aligned with the excitation field. In turn,
2
Search WWH ::

Custom Search