Biology Reference
In-Depth Information
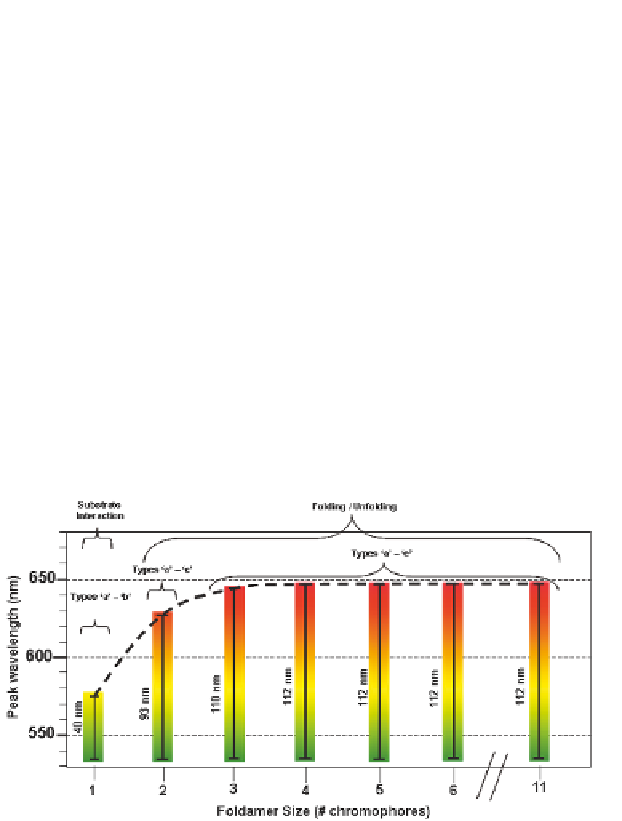
range, up to a point. For example, Fig. 5.27 displays typical spectral
trajectories for the linear pentamer (
), which
exhibits no greater spectral range than the tetramer. Figure 5.28
shows the spectral range within which the molecule averaged peaks
l
5A
) and undecamer (
11
appear as a function of degree of foldamer polymerization, from
monomer (
max
1A
) to hexamer (
6
) and undecamer (
11
). The emission-
peak range (
) is displayed numerically. Single-molecule
measurements reveal that longer foldamers result in larger
∆
l
max
∆
l
max
for dimer (
2A
) through the tetramer (
4A
), after which no further red
from
all trajectory frames locate closely to the average maximum peaks
obtained from the first frame and do not show an increasing trend
for oligomers larger than tetramer. Single-molecule spectra display
emission containing significant infrared tailing because
shift or
∆
l
increase is found. The longest wavelengths
l
max
max
-stack
emission involves high vibronic levels of the ground state; however,
no
π
peaks
are ever observed with wavelengths greater than about
675 nm.
Figure 5.27
Maximum range within which first-frame molecule-averaged
l
was observed as a function of foldamer length. The
max
∆
l
is presented numerically for each oligomer. A wider
range of colors is seen as foldamer size increases up to the
tetramer, after which no further increase in
max
∆
l
is found. A
max
dashed line helps visualize the
l
trend.
max
The maximum exciton coherence length apparently dictates
the extent
-stacked
perylene arrays tens of nanometers long including self-organized
nanofibers [72] and covalently bound photonic wires [71] have
π
-stack emission will red shift. Extended
π

Search WWH ::

Custom Search