Biology Reference
In-Depth Information
Monomer
Dimer
Trimer
Tetramer
Pentamer
Hexamer
Heptamer
1.2
1.0
0.8
0.6
0.4
0.2
0.0
400
450
500
550
600
650
Wavelength (nm)
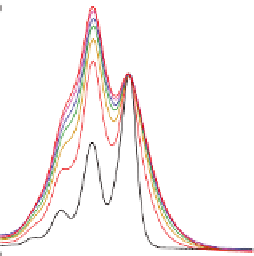
Figure 5.6
Absorption spectra (left) reveal that monomer (
1A
) has
−
a normal Franck
Condon progression, but dimer (
2A
) to
heptamer (
7
) have a dramatic intensity reversal between
0
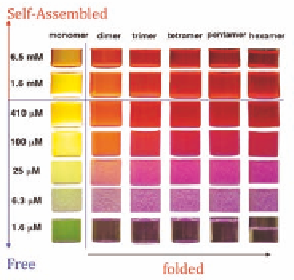
1 transitions. Fluorescence emission (right)
reveals that free monomer emit green color, yet self-
assemblies change this green color to yellow near critical
concentration and orange above critical concentration.
Folded dimer, trimer, etc. emit increasing red fluorescence.
Folded oligomers further self-organize and fluoresce
intensively red.
→
0 and 0
→
When
the
excited
states
are
delocalized
over
multiple
chromophores, the emission originates from
-stack rather than
individual chromophores. Such delocalization has been measured
experimentally in perylene; the excited state can delocalize over
two, three, and four stacked chromophores. The maximum red
shift of
π
π
-stack emission is near 647 nm in the red (see Section
5.7 for further discussions). In Fig. 5.6, the perylene monomer has
dominant emission at 540 nm (0
2), which
give the monomer fluorescence colors from green to yellow. For the
dimer (
→
0) and 575 nm (0
→
), the green photoluminescence peak diminishes while the
emission at 625 nm (0
2A
→
3) increases significantly; the combination of
these three-color photons yields an overall orange red fluorescence.
As the folded oligomers become larger, for instance trimer (
3A
) and
tetramer (
), the photoluminescence at green (540 nm) and yellow
(575 nm) disappears quickly and the net emission color becomes
more and more red. Notice that the red shift from trimer to tetramer
is not significant but the reduction in yellow component (575 nm) is
significant. The complete picture is that monomer (
4A
1A
) emits green
while dimer (
2A
) emits orange and higher oligomers (
3A
-
11
) emit


Search WWH ::

Custom Search