Global Positioning System Reference
In-Depth Information
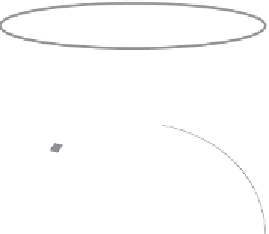
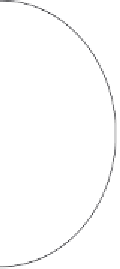
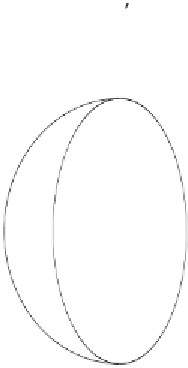
FIGURE A1.
Mercator projection. (a) A cylinder is wrapped around the globe, touching
it only at the equator. Point
A
on the globe is mapped onto point
A
%
on the cylinder.
The latitude of
A
%
is determined by the distance,
s
, of
A
from the equator. A small area
on the globe maps onto a small area on the cylinder. (b) The cylinder dimensions are
shown; it is just long enough to map all latitudes. The North and South Poles map
onto the top and bottom edges of the cylinder. The distance
A
%
E
(let us call it
y
) on the
Mercator map is determined as a function of the latitude
of
A
: see equation (A1).
the cylinder of point
A
% from the equator is just the arc length on the globe of point
A
from the equator. This is the Mercator projection, and it is easier to picture than
to explain in words.
Another way of viewing the Mercator projection is to consider the globe to be a
balloon. Inflate the balloon so that it is squeezed up against the side of the cylin-
der:
A
% is the point on the cylinder that is adjacent to the point
A
on the inflated
globe.
1
In figure A1(b) you can see the same cylinder, wrapped around the earth,
viewed from the side. The height of the cylinder—and so the height of the map—is
p
R
, where
R
is the earth's radius. The width of the map, when the cylinder is
unrolled so that the map is flat, is twice the height, 2p
R
, which is, of course, just
1. An animation of this inflated-balloon view of Mercator projections can be seen at the
University of British Columbia's website at
www.math.ubc.ca/≈israel/m103/mercator/merca
tor.html,
where a math derivation is also provided.