Biomedical Engineering Reference
In-Depth Information
1000
800
600
400
200
0
0
20,000
40,000
60,000
80,000
(A)
Trypsinized cell number
700
600
500
400
300
200
100
0
0
20,000
40,000
60,000
80,000
(B)
Trypsinized cell number
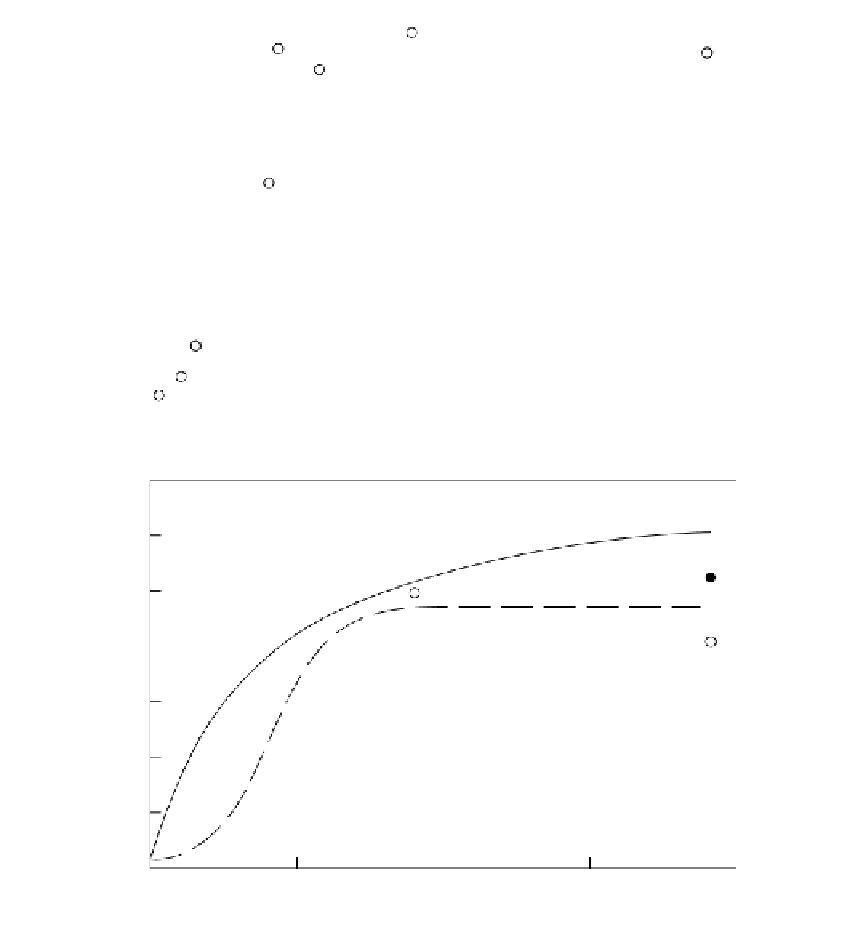
FIGURE 1.32
Plots of the
f
and
R
decreases for ECs attaching to hydrophilically treated gold QCM surfaces. In (A)
f
and
in (B)
R
are plotted vs. the number of electronically counted ECs requiring trypsinization to be removed from
the QCM gold surface. In both panels, the open circles represent 1-h data values (fitted with a three component
sigmoid curve) and the filled circles represent 24-h data values (fitted with a hyperbolic curve) following cell
addition to the QCM surface. In each case these fits represent the best fits to the data. Reprinted with permission
from Marx, K.A., Zhou, T., Warren, M., Braunhut, S. J. (2003). Quartz Crystal Microbalance Study of Endothelial
Cell Number Dependent Differences in Initial Adhesion and Steady-State Behavior: Evidence for Cell-Cell
Cooperativity in Initial Adhesion and Spreading.
Biotechnol. Prog
. 19:987-999. Copyright (2003) American
Chemical Society.
Therefore, during the creation of the cell QCM biosensor, by studying the complex
behavior involved in normal cell adhesion and spreading we reported the novel observa-
tions just discussed. Having formed the cell QCM biosensor, we applied it as a drug
biosensor, as we now describe in the following section. In summary, the QCM provides a