Biomedical Engineering Reference
In-Depth Information
0.1
0.05
0
−
0.05
0
200
400
600
800
(a)
Time (ms)
0.05
0
−
0.05
−
0.1
0
200
400
600
800
(b)
Time (ms)
0.1
0.05
0
−
0.05
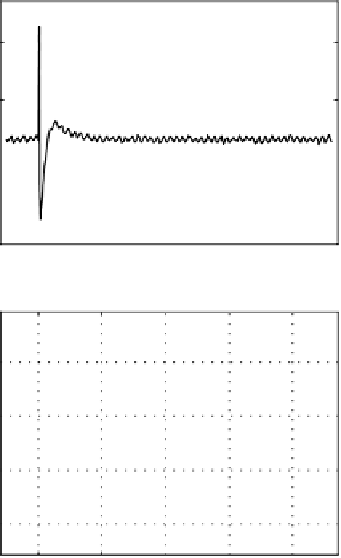
FIGURE 16.12
Time courses of the PERs of (a) wild-type, (b) 4-keto,
and (c) 3,4-didehydro BR elements of the color-sensi-
tive imaging array.
0
200
400
600
800
(c)
Time (ms)
To use the imaging arrays for capturing standard video, the device must be able to
handle pulsing frequencies of 25 Hz. Responsivity of an element in the gray-scale imag-
ing array to pulsing was tested with frequencies higher than 1 Hz. The average photo-
voltage generated by at least 20 pulses at frequencies ranging from 1 to 100 Hz was
measured by using the pulsed light source with constant discharge energy. The result
including the photovoltage amplitude span for each measured frequency is shown in
Figure 16.14. The average photovoltage was about 25% less at 100 Hz than at 1-5 Hz.
Response variance was generally increased at higher frequencies, which was at least
partly due to the light source. The result shows that the gray-scale imaging array was
capable of handling high pulsing frequencies when the level of optical power was low.
No saturation effects were noticed even when 200 pulses were registered at 100 Hz.
Considering the relaxation times in the BR photocycle and the time course of the