Biomedical Engineering Reference
In-Depth Information
wt
4k
de
wt
4k
de
wt
de
wt
4k
de
wt
4k
de
4k
de
wt
4k
de
wt
4k
wt
4k
de
wt
4k
de
wt
de
wt
4k
de
wt
4k
de
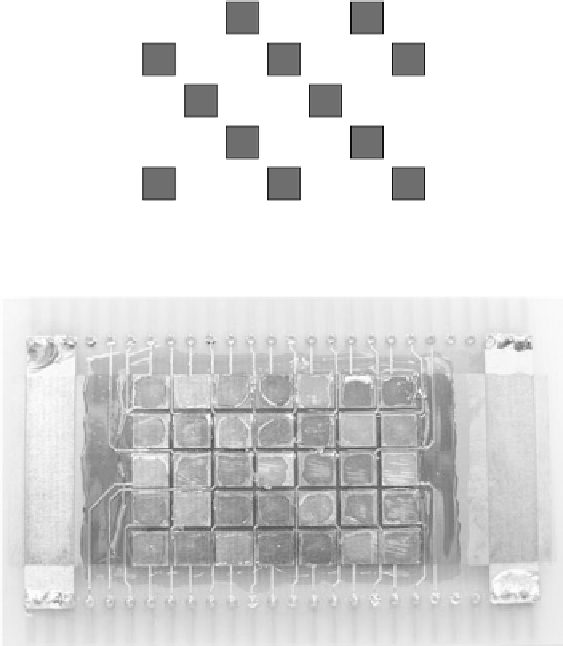
(a)
FIGURE 16.7
(a) Schematic for the color-sensi-
tive imaging array containing
three types of BR: wild type (wt),
4-keto (4k), and 3,4-didehydro
(de). (b) The different absorption
properties of the three types are
clearly visible in the finished
color-sensitive imaging array.
(b)
16.5.4
Measurements
The measurement of photoelectric properties requires a light source and an instrument to
register the electric response. In most studies, the PER is induced by flash excitation, and
the time course of either the photocurrent (closed circuit) or photovoltage (open circuit) is
measured (31). In our studies, a pulsed xenon light source and a regular photographic
camera flash were used for the excitation, and neutral density, interference and wide-band
color filters to change the spectrum of light. We registered the photovoltage because the
sensitivity is approximately invariant of time (31).
The AC PERs from individual elements in the gray-scale imaging device were measured
by using the voltage follower and signal conditioning designed for the photosensors. The
PER of an element using constant discharge energy of 160 mJ and pulsing frequency of 2.0
Hz for the pulsed light source is shown in Figure 16.11. Based on the figure, it is apparent
that there are at least two components with opposite polarities in the response. The
response contains more noise from the environment at 50 Hz but the amplitude was com-
parable to the photosensor with proper focusing of light. The slow negative component is
visible in Figure 16.11a. Note that signal conditioning containing the high-pass filter
affects the slow part of the response, so no time constants related to the components were
determined from the response.