Biomedical Engineering Reference
In-Depth Information
0.7
0.6
0.5
0.4
0.3
0.2
0.1
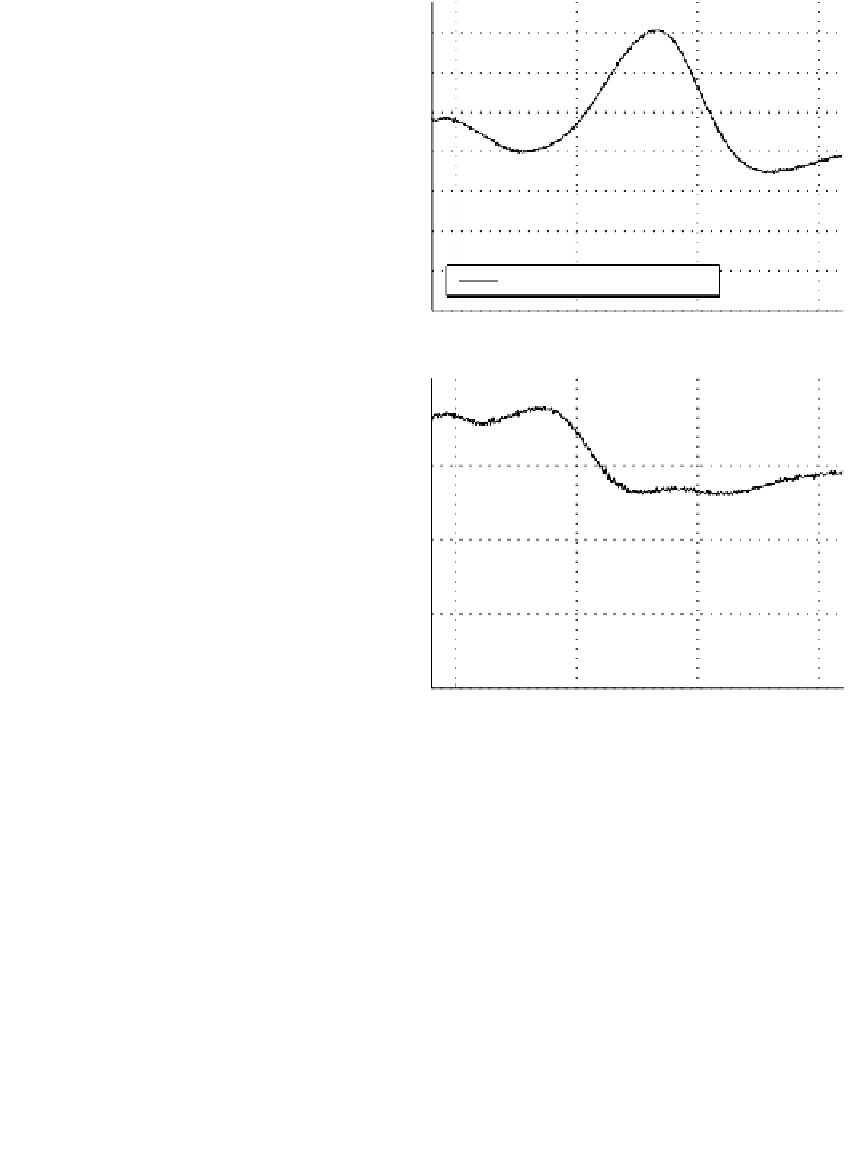
Maximum 0.71 at 568 nm
0
400
500
600
700
(a)
Wavelength (nm)
0.3
0.2
0.1
Maximum 0.38 at 466 nm
0
400
500
600
700
(b)
Wavelength (nm)
0.4
0.3
0.2
0.1
Maximum 0.42 at 587 nm
FIGURE 16.5
Absorption spectra of the (a) wild-type, (b)
4-keto, and (c) 3,4-didehydro BR-PVA pho-
tosensors.
0
400
500
600
700
(c)
Wavelength (nm)
Signal conditioning is also needed because of electromagnetic interference from the
environment. The signal-conditioning stage shown in Figure 16.8 consists of three active
low-pass filters of second order (
3 dB cutoff frequency 5 kHz), and a passive high-pass fil-
3 dB cutoff frequency 7 Hz). Amplification of the signal amplifier is 56.
The measured frequency response of the signal-conditioning stage is shown in Figure 16.9.
ter of first order (