Biomedical Engineering Reference
In-Depth Information
pH
T
24
°
C
6.4
20
100
2.0
pH 1.5, 2.0, 3.0, 4.2, 5.1, 6.1, 7.0, 7.8, 9.4 (26
°
C)
(Normalized and superimposed)
7.6
7.6
C
24
°
C
°
10
50
0
0
−
10
−
50
−
20
−
100
0 0 0 0 0 0 0 0 0 0 0
Time (
0 0 0 0 0 0 0 0 0 0 0
Time (
s)
s)
(A)
µ
(D)
µ
pH
T
pH
T
2.0
7.5
7.3
26
°
C
26
7.0
7.0
2.0
14
°
C
25
100
°
C
10
°
C
26
°
C
25
°
C
50
5
0
0
−
50
−
5
−
100
−
10
0 0 0 0 0 0 0 0 0 0 0
Time (
µ
s)
0 0 0 0 0 0 0 0 0 0 0
Time (
µ
s)
(B)
(E)
pH
T
10
2.0
7.1
7.1
26
°
C
100
15
°
C
5
50
26
°
C
0
0
−
5
−
50
−
10
−
100
0 0 0 0 0 0 0 0 0 0 0
Time (
0 0 0 0 0 0 0 0 0 0 0
Time (
µ
s)
µ
s)
(C)
(F)
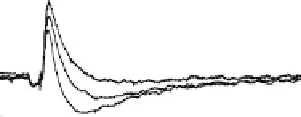
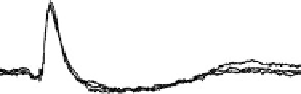
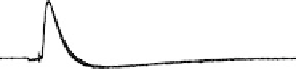
FIGURE 15.9
“Q-tip” experiments. Photosignals from bacteriorhodopsin (bR) thin films, measured at various pH values
and/or temperatures, are shown for: (A) typical TM film. (B) Fresh ML film before stripping with a cotton swab.
(C) Fresh ML film after stripping. (D) aged ML film before stripping. (E) Aged ML film after stripping. (F) In an
aged ML film, photosignals after stripping (from Record E) is shown to superimpose with photosignal before
stripping (pH 6.1 in Record D), if they were normalized to the positive peak of the latter signal. See the cited
source for detailed experimental conditions. (From Michaile, S., Hong, F. T. (1994). Component analysis of the
fast photoelectric signal from model bacteriorhodopsin membranes: Part I. Effect of multilayer stacking and pro-
longed drying. Bioelectrochem. Bioenerg. 33:135-142.)
B
2
) as the pH varies from 6.0 to 1.7. Each signal trace is then com-
pared with a standard
B
1
signal taken from Figure 15.9D after normalization of the peak
amplitude. Figure 15.10B shows the superposition of a
B
2
signal at pH 2.7 (from Figure
15.10A) with the standard
B
1
after normalization of the peak amplitude. Comparison of
Figure 15.10B with Figure 15.10C reveals that the end point is sharply defined, as the end
point must depend on a reasonable superposition of the entire two curves rather than a
single point. This titration experiment permitted us to isolate the pure
B
2
component by
subtracting the normalized
B
1
signal from each composite signal (
B
1
composite signal (
B
1
B
2
) shown in Figure
15.10A (Figure 15.10D). The resulting manipulation shows that
B
2
indeed reverses its
polarity at pH 2.7. Furthermore, the
B
2
component itself appears to be a composite signal.
We have tentatively decomposed it into a
B
2
-c subcomponent with negative polarity and
a
B
2
-a subcomponent with positive polarity. We further found that the
B
2
-c component is
modulated by divalent cations such as Ca
2
and Mg
2
whereas the
B
2
-a component is
modulated by halide ions instead [65].