Biomedical Engineering Reference
In-Depth Information
pH 1
pH 0
pH 2
8
6
4
100
pH 1.5, 2.0, 3.0, 4.2, 5.1, 6.1, 7.0, 7.8, 9.4 (26
°
C)
pH 3
pH 4
pH 5
(Normalized and superimposed)
2
50
0
0
pH 11
pH 10
pH 9
−
2
−
50
pH 6
pH 8
pH 7
−
4
−
100
0
50
100
150
200
250
300
350
400
450
500
0 0 0 0 0
50
0
70
80
90
100
Time (
µ
s)
Time (
µ
s)
(A)
(C)
5
°
C
B1 only
8
100
15
°
C
25
°
C
5
°
C
4
50
35
C
45
°
C
°
0
0
−
−
50
4
−
8
0
−
100
0 0 0 0 0
50
100
150
200
250
300
350
400
450
500
50
0
70
80
90
100
(B)
Time (
µ
s)
(D)
Time (
µ
s)
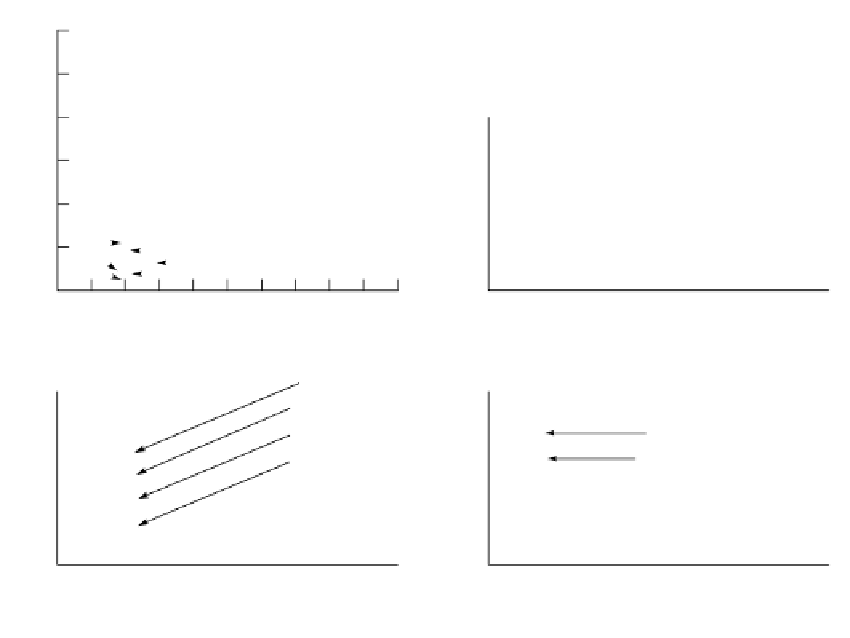
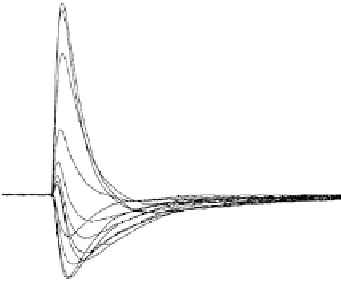
FIGURE 15.6
Effect of pH and temperature on
B
1
and
B
2
. (A) The data, taken from a TM film at 25ºC, illustrate the effect of
varying pH on a composite signal consisting of both
B
1
and
B
2
. (B) The data, taken from a TM film at pH 7, show
the temperature dependence of the composite signal (
B
1
and
B
2
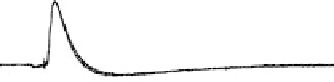
). (C) The data, taken from an multilayered (ML)
film at 26ºC, illustrate the total lack of pH dependence of an isolated
B
1
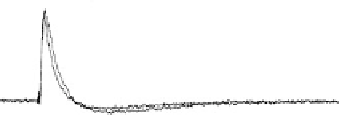
signal. (D) The data, taken from an ML
film at pH 2, shows a small temperature dependence of an isolated
B
1
signal. The temperature and/or pH effect
is fully reversible. All data were measured at
R
e
. For detailed experimental conditions, consult the cited
sources. (From Okajima, T. L., Hong, F. T. (1986). Kinetic analysis of displacement photocurrents elicited in two
types of bacteriorhodopsin model membranes.
Biophys. J.
50:901-912. (A), Hong, F. T., Okajima, T. L. (1987). Rapid
light-induced charge displacements in bacteriorhodopsin membranes: an electrochemical and electrophysiolog-
ical study. In: Ebrey, T. G., Frauenfelder, H., Honig, B. Nakanishi, K. (Eds.).
Biophysical Studies of Retinal Proteins
.
Urbana-Champaign, IL: University of Illinois Press, pp. 188-198. (B, D), and Michaile, S., Hong, F. T. (1994).
Component analysis of the fast photoelectric signal from model bacteriorhodopsin membranes: Part I. Effect of
multilayer stacking and prolonged drying.
Bioelectrochem. Bioenerg.
33:135-142. (C))
40 k
changes of temperature, pH, and electrolyte concentrations [59,60]. The inclusion of the access
impedance in the equivalent circuit is absolutely essential. Furthermore, as the access imped-
ance is varied, the apparent relaxation-time course varies in accordance with the prediction
of the equivalent circuit. In other words, regardless of the value of the access impedance, the
intrinsic photochemical relaxation-time constant (
p
) extracted by means of deconvolution of
the measured apparent relaxation-time course remains the same: 12.3
s. We also found
that the apparent relaxation-time course of the
B
1
component varies with the thickness of the
Teflon substrate, but then, again,
0.7
p
remains unchanged [66].
B
1
exhibits a slight temperature
dependence, which corresponds to an activation energy of 2.54
0.24 kcal mole
1
[59].
The dramatic pH dependence exhibited by a TM film (Figure 15.6A) is to be contrasted
with the absence of pH dependence, which was widely reported in the literature. As
explained in Section 15.3, the commonly used open-circuit method lacks the sensitivity to
detect the pH-induced change of the intrinsic photochemical relaxation. The insensitivity is