Biomedical Engineering Reference
In-Depth Information
(a)
(d)
(g)
1
µ
m
200 nm
200 nm
(b)
(e)
200 nm
200 nm
(h)
2
µ
m
0.01
Ω
-cm
0.1
Ω
-cm
0.001
Ω
-cm
(c)
(f)
(i)
0
50
100
150
200
0
100
0
500
1000
150
200
250
Pore-to-pore distance (nm)
Pore-to-pore distance (nm)
Pore-to-pore distance (nm)
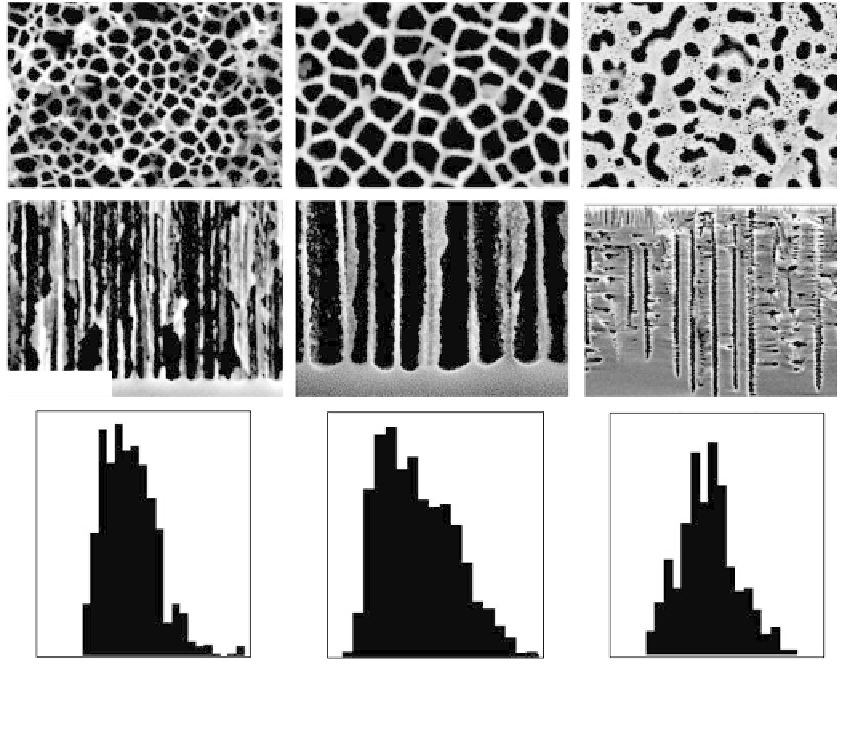
FIGURE 11.13
Top view and cross-sectional SEM images and pore-to-pore distance histograms of macropores etched on
n
-type
silicon wafers with different resistivities: (a-c
)
0.001 ohm-cm; (d-f
)
0.01 ohm-cm; (g-i
)
0.1 ohm-cm.
Two sets of encoded particles were examined in the Sailor study (Figure 11.14). The first
set, encoded at 750 nm, was treated with a concentrated solution of bovine serum albumin
(BSA). The second set, encoded at 540 nm, was treated with a solution of rat albumin, and
then with a rabbit antirat-albumin antibody solution. The two sets of particles were then
mixed, and exposed to a solution of a fluorescence-tagged goat antirabbit IgG.
Importantly, when the reflectance spectra of particles that had taken up the fluorescent
antibody were measured, all were found to have maxima at 540 nm. That is, only those
particles treated initially with rat albumin and antirat-albumin took up the target fluores-
cent antibody, and the rugate filter “code” for those particles could be read retrospectively.
This is a particularly impressive result, given that the probe molecules were only nonco-
valently adsorbed onto the particle surface rather than covalently attached. In the context
of sensing, one could envision employing this scheme in situations where detection of
multiple analytes simultaneously in solution was desirable.
47
11.9.2
Electrical Sensors as an Alternative Biosensing Mechanism
While the vast majority of studies on PSi as a biosensing platform have focused on optical
signaling, changes in the electrical properties of PSi as a function of environment have also