Biomedical Engineering Reference
In-Depth Information
Before mounting
Mounted
3 days later
1 yr
120
100
80
60
40
20
0
600
650
700
750
800
850
900
950
Wavelength (nm)
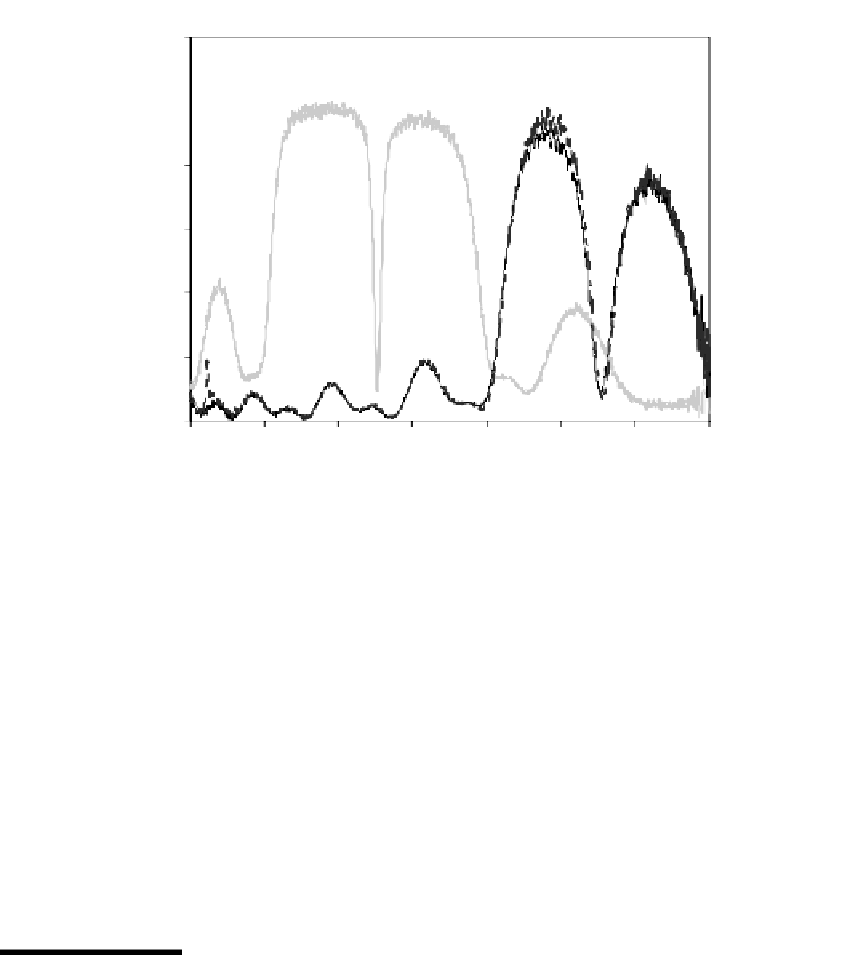
FIGURE 11.12
Reflection spectra for a free-standing 5.2-
m thick microcavity membrane, before and after mounting in a hydro-
gel sheet.
process, allowing fabrication of microcavities. Two systems were examined to provide an
initial proof of concept for biosensing with these devices. First, chips were exposed to
varying concentrations of rabbit immunoglobulin G (IgG). IgG is a fairly large protein (150
kDa, or ~17 nm along its largest dimension) that does not infiltrate into mesoporous
microcavities well. However, a clear concentration dependence in the redshift of micro-
cavity response was available post-IgG exposure, indicating that infiltration of the protein
was facile. Second, biotin was covalently attached to the surface of a macroporous micro-
cavity, and used as a probe for streptavidin. Indeed, as one would expect, chips function-
alized with biotin showed a redshift after exposure to streptavidin, while those lacking
biotin did not.
11.9
Alternative Sensing Modes and Device Structures
11.9.1
“Smart Dust”
Building on their 1992 observation that ultrasonic treatment of PSi can produce suspen-
sions of luminescent particles,
42
Sailor and collaborators published two reports in 2002
detailing the use of such “smart dust” in chemical
43
and biological
44
sensing. We will
focus on the biological application here. PSi samples were etched as rugate filters, or
devices in which sinusoidal variation in the refractive index produces a narrow band of
high reflectivity (in this case, 11 nm) at a specific wavelength. Control over the precise
placement of this high reflectivity band allows for the production of “encoded” particles,
conceptually similar to the “smart beads” of Nie
45
or the infrared-encoded polystyrene
resins of Fenniri.
46