Biomedical Engineering Reference
In-Depth Information
20
µ
m
40
µ
m TMPP
80
µ
m TMPP
70
1600
1400
60
1200
50
1000
40
800
30
600
20
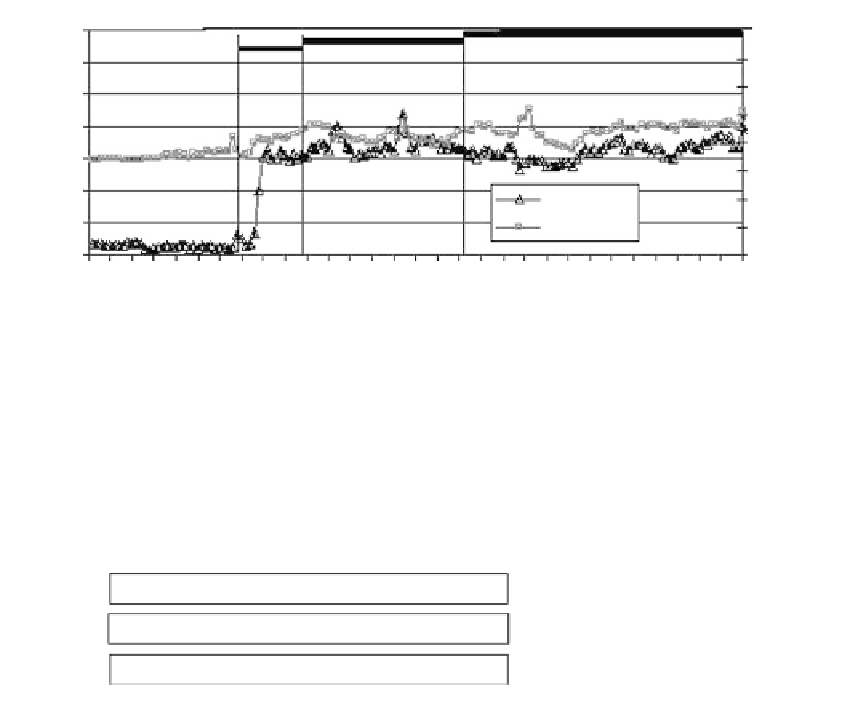
Burst rate
Spike rate
400
10
200
0
0
0
25
50
75
Time (min)
100
125
150
FIGURE 6.17
Organization of activity pattern from spiking with minimal embedded bursting to extensive bursting without a
major change in network spike production. TMPP is a bicuculline analog and generates epileptiform network
response patterns.
1
Reversible
FAST
BPD
BDD
SAD
CTD
1
Inhibitory
1-5
1
2
3
4
SLOW
2
Irreversible
Basic response
category
Speed of
response
Activity decay profile
Reversibility
2
Excitatory: Increases in network spike
3
Biphasic: Excitation followed by inhibition
4
Disinhibitory; Burst oscillations and coordination
FIGURE 6.18
A number scheme for the classification of response profiles and possible identification of unknown compounds
based on a matching of number sequences representing major features of activity changes. For explanation, see text.
normal and also retain some of the cellular burst-shape characteristics. Botulinum toxin
would be identified by the sequence 1, 1, (1, 2) 2. Here, both the burst period and duration are
affected as the network activity dies. Finally, the GABA
A
receptor blocker bicuculline can be
identified by 4, 4, 0, 1 as it generates disinhibition, is relatively fast, does not generate burst
activity decay, and is reversible. Application of this scheme will undoubtedly generate some
new categories and lead to a simple classification system that will allow rapid comparisons
of unknown compound responses with a library of established response profiles.
Several other methods may prove useful to achieve quantitative discrimination of classes
of compounds based on mechanisms of action, including artificial neural networks, linear
discriminant analysis, and self-organizing maps. In fact, artificial neural networks have been
used with hippocampal slice recordings [34] and are likely to prove useful for the NNBS. An
alternative approach is based on binary decision tree classifiers where qualitative aspects of
the NNBS response are used as inputs. Characteristic changes in the response profile can be
used to perform classification. This approach has been successful using fish chromatophores,
another cell-based biosensor paradigm under consideration for water toxicity testing [35].
6.4.2
Sample Introduction and Resistance to Chlorine
Whether used as a remote detector or as a test platform in a laboratory facility, it is desir-
able to introduce water samples in the most direct manner to the culture medium without