Biomedical Engineering Reference
In-Depth Information
(c)
(b)
(a)
bp
T1
T2
ba
bd
1.0
1.5
5.0
Seconds
5.3
7.0
7.5
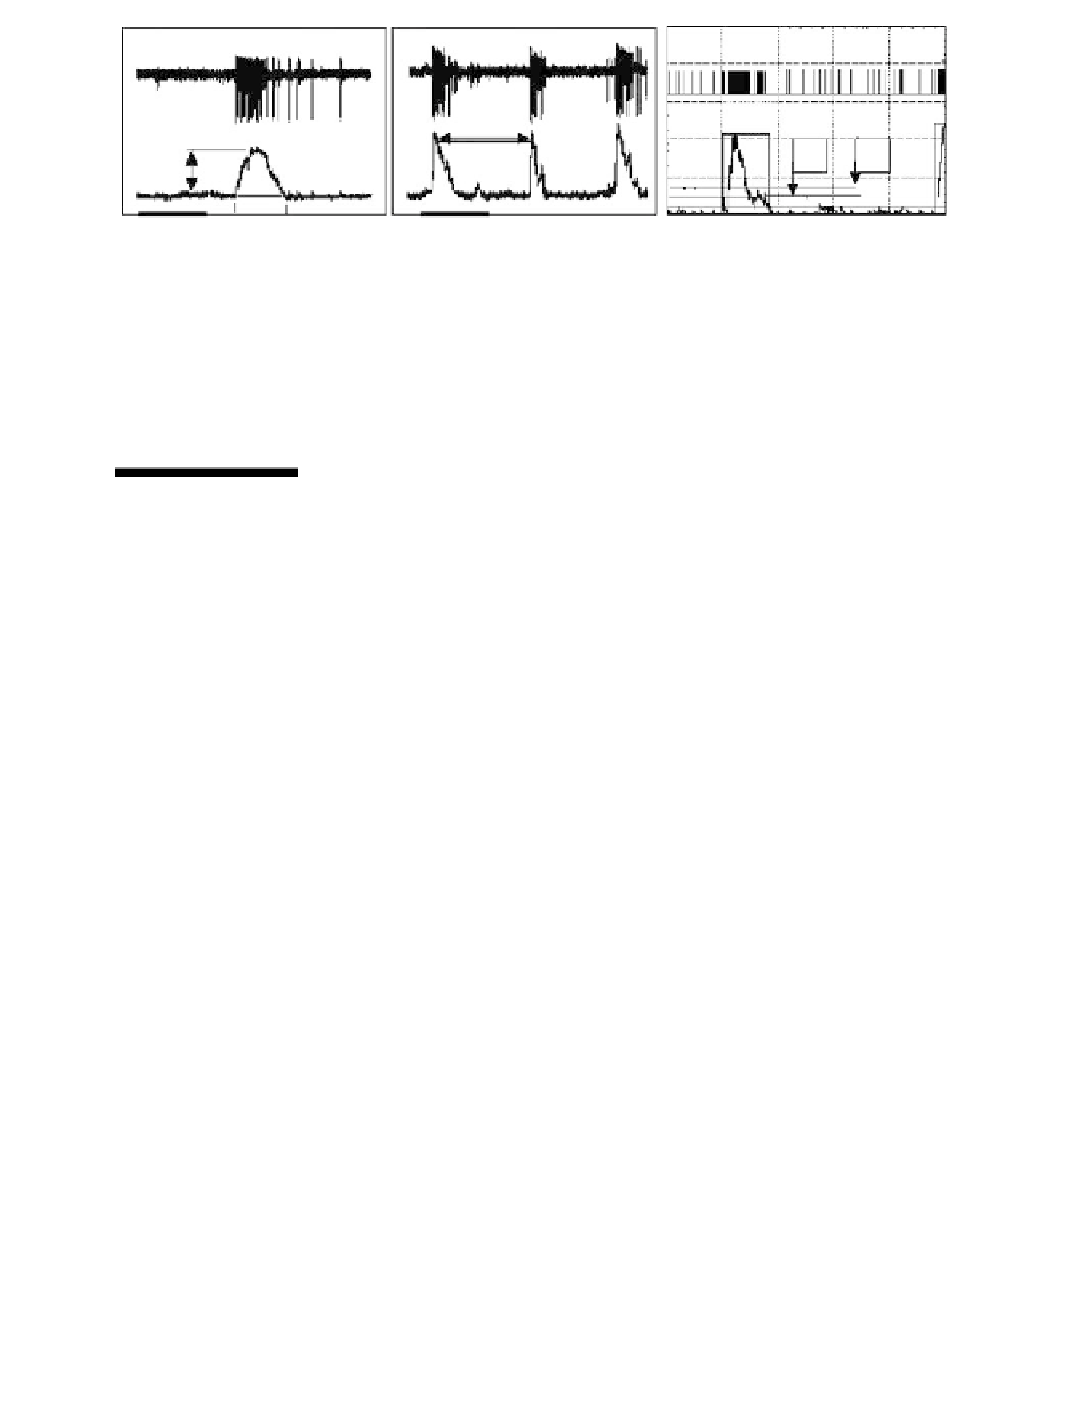
FIGURE 6.7
Burst detection and quantification using integration. (a) Analog channel activity, (b) digital channel activity, and
(c) discriminated unit activity showing three activity variables: burst amplitude (ba), burst duration (bd), and
burst period (bp). Burst rate (usually per minute) and area under the burst outline are also extracted. Digital
burst detection is based on a two-threshold method where the first threshold (T1) identifies the start of a burst
only if T2 is reached in 100 ms thereafter.
6.3
Network Response Profiles
6.3.1
Pharmacological Dose Responses
Experimental networks do not have to display identical activity patterns to allow quanti-
tative comparisons between networks. If each network is treated as an individual and all
changes in activity are referenced to the native activity of that culture, then dose response
reproducibility can be achieved. This is illustrated in Figure 6.8, which depicts the
response of a frontal cortex network to ethanol [16].
In this example, a slow, partial activity recovery complicates the determination of
response plateau values. Because of the high ethanol volatility, ethanol was added to the
wash bottle that humidified the CO
2
-air mixture at the same concentration as that in the
recording chamber. Ethanol concentrations in the bath medium were measured with a
diagnostic kit (Sigma Diagnostics Inc., St. Louis, MO) and confirmed that concentrations
were stabilized. The activity recovery was not considered as linked to ethanol evaporation.
A similar activity rebound was seen with low concentrations of anandamides [17]. Table 6.1
shows the overlap between cell culture and animal experiments.
Figure 6.9 shows results from an analysis of novel pharmacological compounds
designed to inhibit acetylcholinesterase [18]. A series of seven symmetrical, bifunctional
alkylene-linked bis-thiocarbonate compounds were tested, all of which had been charac-
terized biochemically as mixed inhibitors of AChE, with
K
i
's in the 10
-7
-10
-6
M range. The
neuronal network assays revealed high repeatability for each compound but, surprisingly,
diverse effects among these closely related structures. Six of the seven compounds pro-
duced changes in network activity at concentrations from 10-350 µM. Three were excita-
tory, two were biphasic (excitation followed by inhibition), and one was solely inhibitory.
Two of the inhibitory compounds produced irreversible inhibition of activity and were
considered to be functionally neurotoxic in the absence of cytotoxicity. Only two com-
pounds showed activity profile changes consistent with that of a classic AChE inhibitor.
This study demonstrated that spontaneously active neuronal networks reflect the interac-
tions of multiple neurotransmitter and receptor systems, and can reveal unexpected side
effects due to secondary binding that can have dominant effects on neurophysiological
function.