Biomedical Engineering Reference
In-Depth Information
SOFM cluster
unit
Shape characterizes the
information embedded in the
numeric data
Origin
Class 1
w
i,j,k
Class 2
x
1
x
2
x
3
x
n
. . .
Class 3
x
p
(input feature vector)
Color (shade) reflects
class boundaries
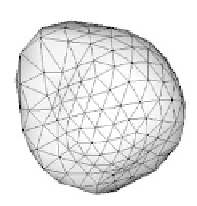
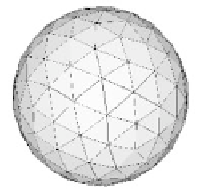
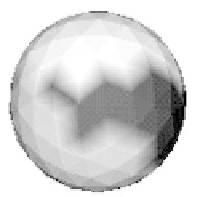
FIGURE 5.11
Spherical SOFM used to enhance visualization and assist in data exploration.
independent coordinate system (59,60). Correspondingly, color is added to reflect a meas-
ure of information that relates the weight vectors of the cluster units. The color values
assigned can be scaled to lie in the visible range of the color spectrum, and thus every node
will have a color vector associated with it. The resulting color-coded deformed spherical
representations can provide a comprehensive visual representation of different aspects of
information embedded in the numeric data.
The process of multidimensional data clustering for enhanced scientific data visualiza-
tion is now illustrated using the same Wisconsin breast cancer data (48) described in
Section 5.3.2.2. Again, the dataset consists of 683 FNA tissue samples preclassified into two
categories: malignant and benign tissue samples. Every FNA tissue sample is a vector con-
sisting of nine attributes that need to be considered to make a correct diagnosis. Each
attribute is assigned a value between 1 and 10 by the pathologist, with 10 indicating a very
high probability of malignancy.
The training data vectors are randomly selected and presented to a spherical SOFM net-
work that consists of 642 cluster units uniformly distributed on a tessellated sphere. An ini-
tial neighborhood of 3 units radius is selected and the network is trained for approximately
200 cycles. On completion of the training process, the spherical lattice is deformed and
color-coded to reflect information about the physical phenomenon. The spherical lattice is
color-coded using prior information on the two categories of samples, red indicating malig-
nant tissue and yellow representing benign tissue samples. Figure 5.12 presents the same
colorized glyph from two separate viewpoints. All the malignant samples contribute to the
elevated red region in the shape. A misclassified tissue sample is identified in the right
view. A slightly above average value (6.0) for clump thickness and a value of 10 for the