Geoscience Reference
In-Depth Information
Other approaches to climate sensitivity
It has already been mentioned that high sensitivity is related to long response times and
that leads to a pronounced difference in the response to sequences of volcanoes. Figure 6
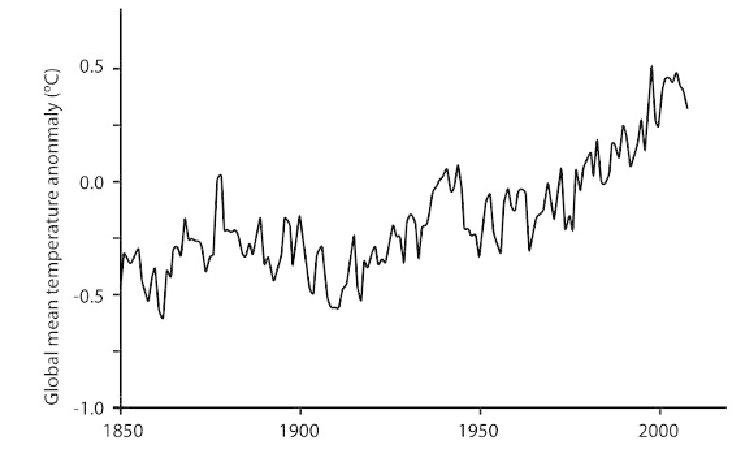
is the famous figure of the record of global mean temperature anomaly. Volcanoes appear
as isolated dips consistent with low sensitivity (Figure 3). Relatedly, the broad minimum
in temperature between 1883 and 1950 seen in Figure 5 is absent in the observed series.
Models, however, have openly used hypothetical pictures of aerosols and solar influence
to eliminate this discrepancy. Given the numerous possibilities for bringing observations
and models into agreement, one might reasonably try to find more direct measurements of
sensitivity.
Figure 6: Globally averaged temperature anomaly as a function of time
Source: R. Lindzen
The response time that we have discussed is simply a measure of the thermal coupling
of the atmosphere to the ocean. High sensitivity is associated with weak coupling and low
sensitivitywithstrongcoupling.Thus,asGerardRoenoted,itshouldapplymoregenerally
theaforementionedElNiño-SouthernOscillation,PacificDecadalOscillation,andAtlantic