Geoscience Reference
In-Depth Information
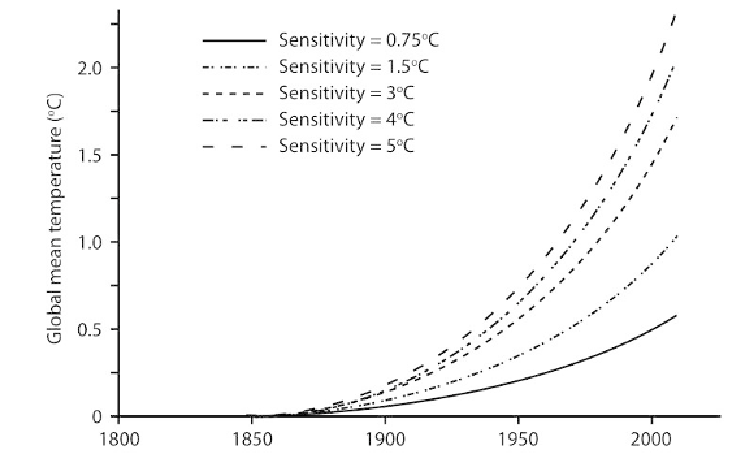
Figure 2: Response of global mean temperature to anthropogenic greenhouse forcing
for various choices of climate sensitivity
Source: R. Lindzen
Figure 3 shows the response of the same models to the volcanic forcing. Here the
response time plays a particularly striking role. For low sensitivity, the response consists
in episodic dips corresponding to each eruption (much as observed), while for high
sensitivities, there is a secular trend leading to a net cooling of about 0.3°C at present.
The absence of any evidence of this in the data already points to low sensitivity. However,
for the present exercise, this means that the warming due to high sensitivity is moderated
to an important extent by the accompanying secular cooling due to volcanoes. Figure 4
shows the response to the sum of greenhouse and volcanic forcing. It is still the case that
onlysensitivities underabout1°Careconsistent withtheobservations.However,theIPCC
suggests that aerosols constitute a highly uncertain potential source of cooling. Modelers
have been able to invoke this uncertainty in order to adjust the net anthropogenic forcing
(i.e. the sum of greenhouse forcing and aerosol forcing) to match the observations (Figure
5).Table1showshowmuchofthegreenhouseforcinghastobecancelledinordertoreach
agreement. For the sensitivities in excess of 1.5°C, this is about half of the 3 Wm
-2
, and
already in excess of what the IPCC considers the likely aerosol contribution, but recent
work suggests that even this estimate for aerosols is much too great.