Geoscience Reference
In-Depth Information
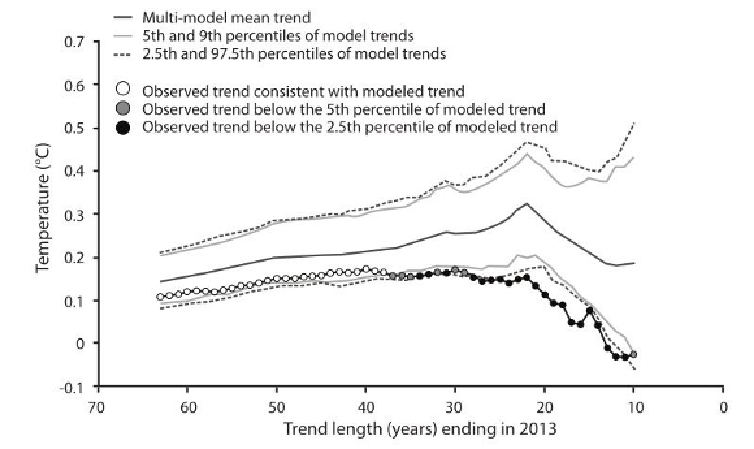
(climexp.KNMI.nl). We calculated the model trends for periods beginning at ten years (i.e.
2004-2013), eleven years (2003-2013), etc., all the way back to 1951-2013.
For each trend length, we ranked the 108 trend values from the individual model runs.
From this ranked data set, we determined percentiles. Given the sample size, directly
obtaining percentile rankings better characterises and constrains the properties of the data
thanprobabilities derivedfromtheassumption ofnormality.Inspection showsthatthedata
are not grossly non-normal as do other similar analyses examining the collective trends
from climate model projections.
5
We calculated the average warming produced by the 108 models, as well as the
following percentile values: 2.5, 5, 95, and 97.5. The fifth and 95
th
percentiles are given as
the light grey lines in Figure 1, while the broken lines are the 2.5
th
and 97.5
th
percentiles.
The average is given by the solid grey line near the midpoint of the percentile bounds. We
then compared these trends to the observed trends in the HadCRUT4 temperature history.
6
These are given as the large circles.
Figure 1: Observed vs modeled surface temperature trends (trends end in 2013)
Source: P.J. Michaels