Biology Reference
In-Depth Information
and reduced infarct volume and improved neurological symptoms after
brain ischemia/reperfusion in rats (
Chen, Raman, Bodendiek, O'Donnell,
& Wulff, 2011
).
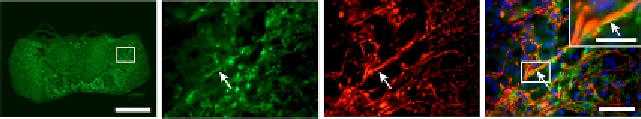
We found that spinal cord contusion injury induced a significant
upregulation of KCa3.1 mRNA between 3 and 28 days and protein
between 5 and 28 days (
Bouhy et al., 2011
). We were surprised to find that
after SCI, the expression of KCa3.1 was upregulated in reactive astrocytes
but not microglia/macrophages in tissue sections (
Fig. 5.2
). We found, how-
ever, that microglia/macrophages acutely isolated from the contused spinal
cord 7 days after injury and plated
in vitro
for 2 h expressed KCa3.1, as did
microglia purified from the neonatal CNS. The reasons for the lack of ex-
pression in microglia and macrophages in the injured spinal cord
in vivo
are
not clear at present (see
Bouhy et al., 2011
for further discussion). Interest-
ingly, however, treatment with TRAM-34 reduced secondary tissue dam-
age including ventral horn neuron loss, tissue loss estimated by GFAP
labeling, and axonal loss estimated by antineurofilament labeling.
TRAM-34 treatment also reduced expression of IL-1
b
, TNF-
a
, and iNOS.
Importantly, blocking KCa3.1 with TRAM-34 after spinal cord contusion
injury improved locomotor recovery in a dose-dependent manner, being
most effective at a dose of 120 mg/kg/days. These findings suggest that
KCa3.1 could be a therapeutic target for treatment of SCI. Reactive
astrocytes in the injured spinal cord are generally thought of as preventing
axon regeneration by forming the glial scar and expressing CSPG that
inhibits axon growth (
Silver & Miller, 2004
). Our findings show that
reactive astrocytes might also contribute to the inflammatory response via
KCa3.1
KCa3.1
GFAP
Merge
A
B
C
D
Figure 5.2 (A) Low-magnification image of the contused spinal cord at 7 dpi immuno-
stained for KCa3.1. The area in the box is shown at higher magnification in (B
-
D). The
high-magnification images show double labeling for KCa3.1 (B) and GFAP (C) (arrows)
and the merged images with DAPI-stained nuclei (D). Note the KCa3.1 labeling of
GFAP
þ
-reactive astrocytes (arrows); the inset in (D) shows double-labeled profiles at
higher magnification (arrow). In the inset, note that the strongest labeling for KCa3.1
is on the membrane while the GFAP labeling is intracellular. Scale bars: A¼500 mm,
D
¼
50 mm, inset
¼
30 mm.
With permission from
Bouhy et al. (2011)
.