Geography Reference
In-Depth Information
Figure 45: Available Vector Layers
As you can see, the two point layers we imported earlier and the polygon layer we imported
using GeoKettle are available. Select all of them and click
Add
.
After a bit of processing, depending on your computer and database speed, QGIS should
display the layers, hopefully in three different styles.
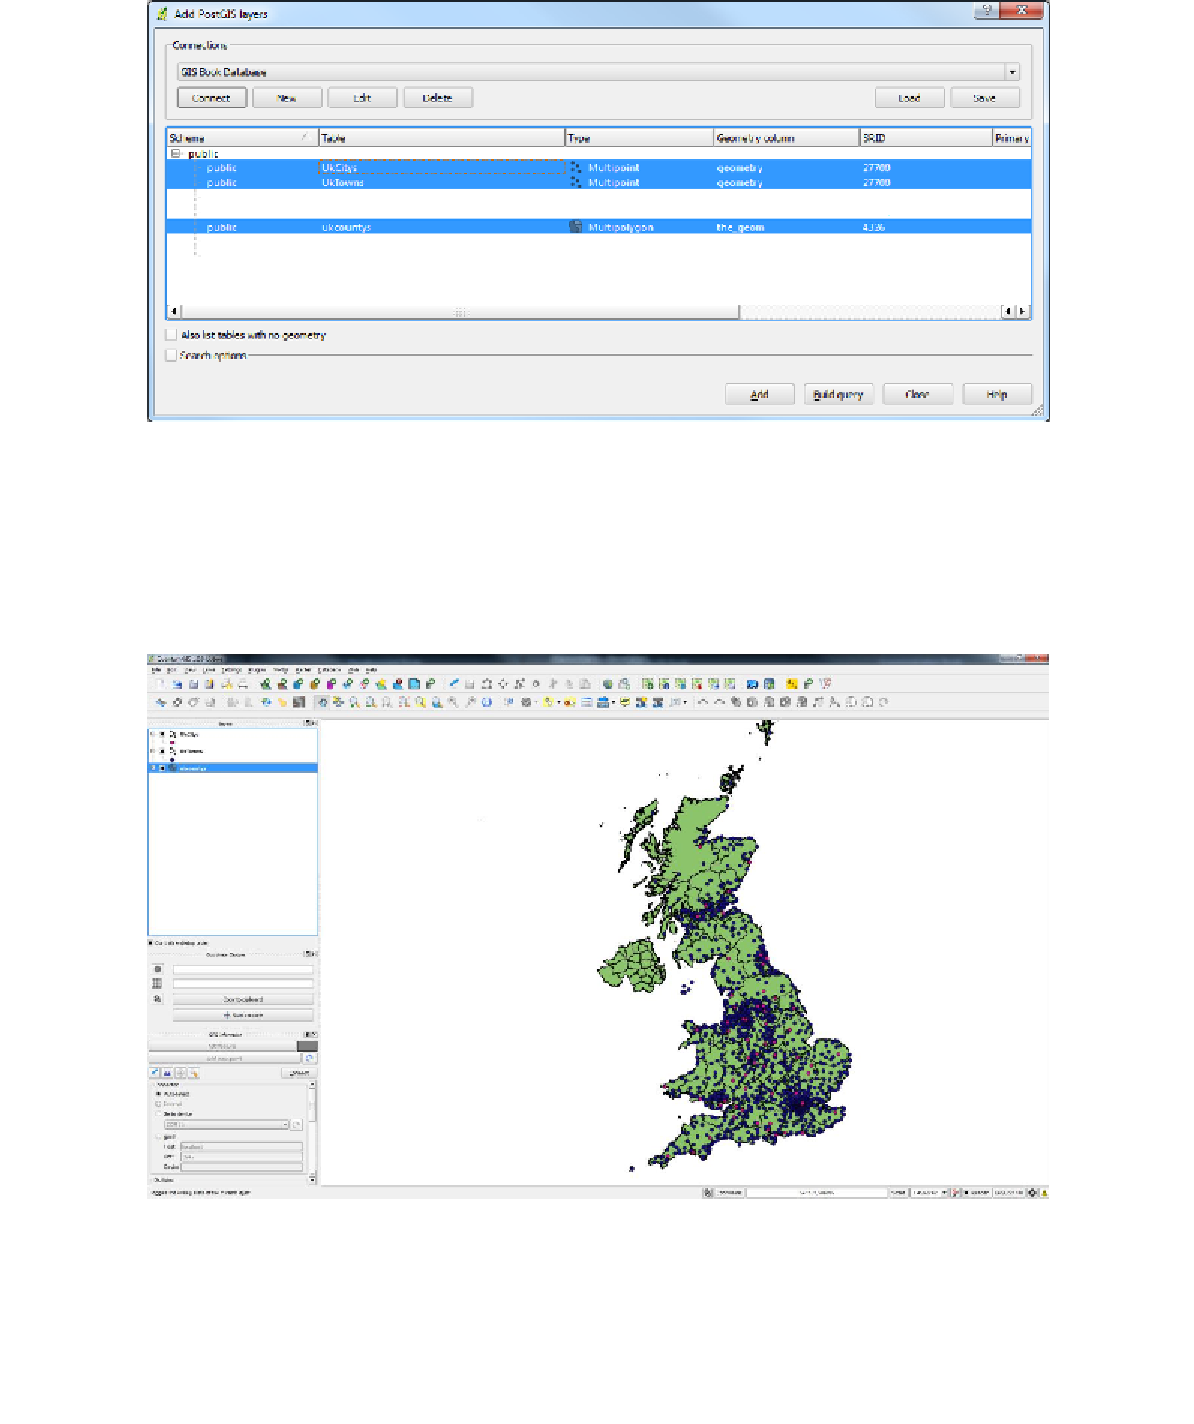
Figure 46: Loaded Map with Three Layers
As shown in my example in Figure 46, county boundaries are in green, towns are dark blue,
and cities are pink.
If your display looks anything like mine, then congratulations, you've just created your very
first spatially enabled database. Now we get to play with this data.