Information Technology Reference
In-Depth Information
1
1
d
=0
d
=1
d
=4
d
=10
d
=0
d
=1
d
=4
d
=10
0.8
0.8
0.6
0.6
0.4
0.4
0.2
0.2
0
0
0
0.1
0.2
0.3
0.4
0.5
0.6
0.7
0
0.1
0.2
0.3
0.4
0.5
0.6
0.7
s
s
(a)
(b)
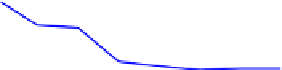
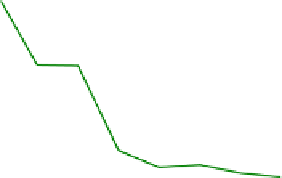
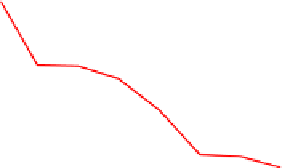
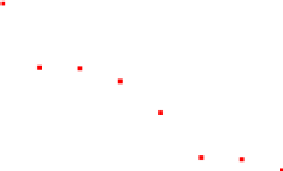
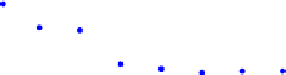
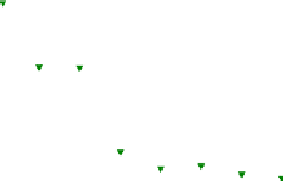
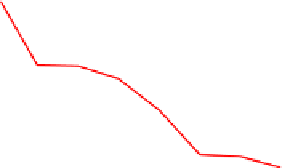
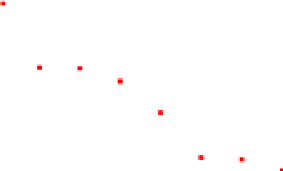
Fig. 17.9. Order parameters v
a
(a) and v
d
(b) vs. the noise level for dierent values of . Other
parameters (except for ) are as in Fig. 17.6(a).
= 0, even low values of lead to poor leadership eectiveness, while when 6= 0
leadership is eective at least for low values of the noise level.
17.3.3. Proximity graphs and topological interactions
Although most of the models share a networked structure to model the interactions
between agents, the denition of such network is not univocal. In [Bullo et al. (2008)]
many examples of construction of the interaction network (also called proximity
graph) are given. Among them, we cite:
the r-disk graph in which two agents are neighbors if their locations are within
a distance r;
the Delaunay graph in which two agents are neighbors if their corresponding
Voronoi cells [Aurenhammer (1991)] intersect;
the r-limited Delaunay graph in which two agents are neighbors if their corre-
sponding r-limited Voronoi cells intersect;
the visibility graph in which two agents are neighbors if their positions are
visible to each other.
Beyond the denitions stated above, another technique of construction of the
proximity graph, emerging from experimental observation, should be considered. In
fact, in a recent paper, Ballerini et al. (2008) showed that the interaction between
birds in airborne ocks is governed by a topological distance rather than a metric
one. In particular, through an accurate study based on image processing performed
on bird ocks they showed that each bird interacts on average with a xed number of
neighbors (six-seven), rather than with all neighbors within a xed metric distance.
In the simulations and in the results discussed so far, the r-disk graph has been
considered. In this Section, we compare some features of the Vicsek's model in