Information Technology Reference
In-Depth Information
adverse ones more swiftly. This makes local assortment of Cs more eective, en-
hancing the feasibility of Cs' survival, as shown in Fig. 16.8. When Cs' willingness
to change is low or absent (
C
= 0:5 and
C
= 0:0) compared to Ds (
D
= 1:0),
Cs' chances decrease with respect to the situation in which Cs and Ds react equally
swift to adverse ties (
C
=
D
= 1:0). Comparing these results with those in which
all social ties remain immutable (
C
=
D
= 0:0) does, however, show that the
rewiring of DD links alone is already benecial for cooperation.
The rewiring of links, no matter which ones, creates heterogeneous networks
that are known to provide cooperators with an environment in which they may
acquire an advantage over defectors. Thus, even when cooperators are resilient to
change, their behavior prospers at the expense of defectors' greed.
From these results, one might expect that swift reaction to adverse social ties will
evolve when is considered as an evolutionary trait. This intuition does, however,
not always hold. We start each evolutionary run by selecting each individual's
from a uniform distribution. We analyze the distribution of at the end of
the evolutionary process, when the population reaches xation (i.e., all individuals
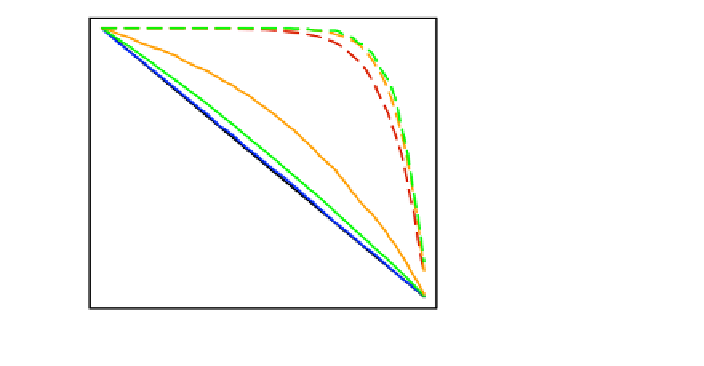
adopt the same game strategy). The lines in Fig. 16.9 correspond to the cumulative
distribution C() of (C(
0
) being dened as the fraction of individuals with
>
0
) for both C (solid lines) and D individuals (dashed lines). The initial
distributions of lead to the black diagonal line; the nal distributions are shown for
dierent values of the game parameter T. In the regime where cooperators dominate
1.0
(3)
(4)
(5)
1.0
0.8
1.0
y
f
s
(4)
0.8
0.8
0.6
(3)
0.6
0.6
(1)
C()
&
(2)
0.4
0.4
0.4
0.2
0.2
(1)
(2)
(3)
(4)
(5)
Initial distribution
T
= 1.5
T
= 1.8
T
= 2.1
T
= 2.4
0.0
Initial distribution
T = 1.5
T = 1.8
T = 2.1
T = 2.4
0.0
0.2
1.5
2.0
2.5
1.5
2.0
2.5
T
(
S
= 1-
T
)
0.0
0.0
0.2
0.4
0.6
0.8
1.0
0.0
0.2
0.4
0.6
0.8
1.0
Fig. 16.9. Evolution of for cooperators and defectors. The solid (dashed) lines show the fraction
of cooperators (defectors) having an eagerness to change links larger than , and this for dierent
values of T (W = 5, = 0:005, N = 10
3
, z = 30). The inset provides the fraction of runs ending
in 100% of cooperators as a function of T. The values of are uniformly distributed in [0; 1] at
the start of each evolution, as indicated in black. Cooperators that react swiftly to adverse ties
are only favored by natural selection when defectors start to become competitive (1:8T2:1).
Swift defectors, on the other hand, are always selected, but the strength of this selection pressure
drops as T increases. C(
0
) is dened as the fraction of individuals who have
0
.