Information Technology Reference
In-Depth Information
1
200
z = 40
z = 40
0.8
z = 30
150
n
f
s
z = 20
0.6
z = 30
x
z = 10
100
k
0.4
z = 20
z = 10
50
0.2
0
0
0
2
4
6
8
10
0
2
4
6
8
10
W
W
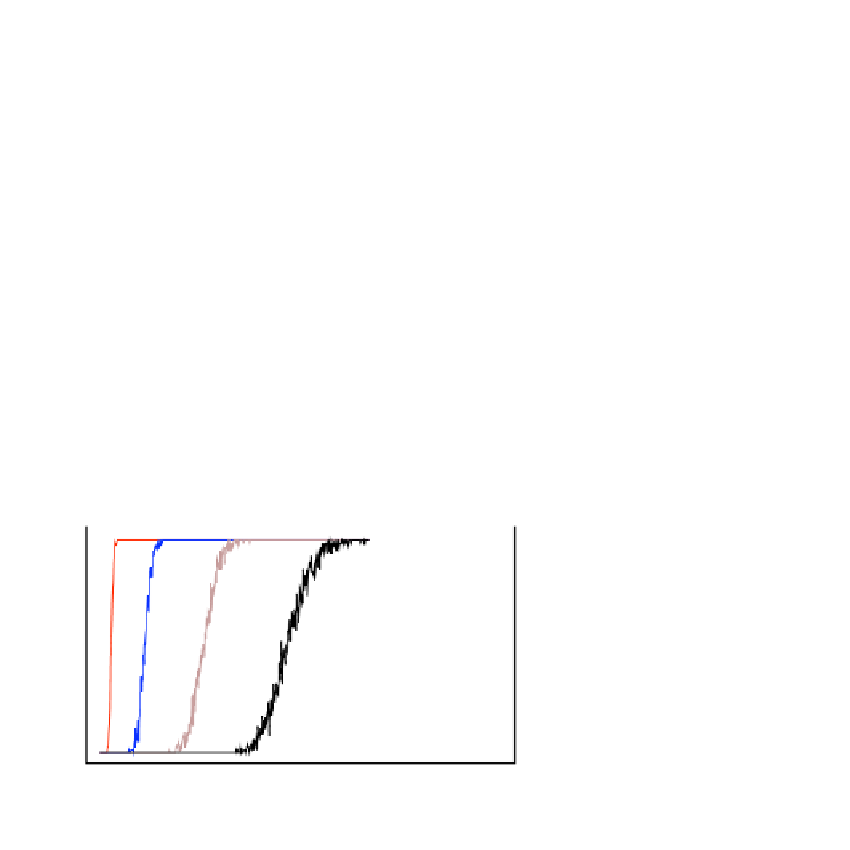
Fig. 16.6. Co-evolution of strategies and links in the game region in which defectors should
dominate for dierent time-scales. Left panel: Final frequency of cooperators at end as a function
of W for dierent average connectivity z. For each average connectivity z, there is a critical value
of the time scale ratio W { W
critical
{ above which cooperators wipe out defectors. Right panel:
Connectivity k
max
of the largest hub in the network, as a function of the time scale ratio W. With
increasing z, W
critical
increases. In all cases, the heterogeneity of the associated network becomes
maximal at W
critical
. For higher values of W, the heterogeneity decreases again when defectors
decrease in frequency. For high values of W, defectors are wiped out and only the heterogeneity
generated by the rewiring mechanism in a neutral system prevails (Payos R = 1, T = 2, S =1
and P = 0. Intensity of selection = 0:005).
value reects the mean value of the average connectivities reported in [Dorogotsev
and Mendes (2003)] for socials networks). We plot the fraction of cooperators who
survive evolution, averaged over 100 independent realizations for the same values
of the game payo entries (T;S) and the time scale ratio W. For W = 0 the results
reproduce, as expected [Santos et al. (2006b)], the predictions for nite, well-mixed
populations. Yet, with increasing W, cooperators gain an advantage, as they can
terminate their undesirable interactions with defectors. Rewiring changes the strat-
egy dynamics and paves the way for a radically distinct evolutionary outcome in
which cooperators are now able to dominate for the entire range of games. Under
structural dynamics, cooperators can cut their links to defectors, which gives them
an advantage compared to the situation on a static network. The swifter the re-
sponse of individuals to the nature of their ties, the easier it gets for cooperators to
wipe out defectors. Note further that cooperators already dominate defectors for
W = 4, corresponding to a situation far from the time-scale separation conditions
dened in Section 16.2.3.
Additional insight is provided in Fig. 16.6 (left panel), where we show how
cooperation dominates defection as a function of W when T = 2 and S = 1 (lower
right corner of the panels in Fig. 16.5), which represents the most challenging case
for cooperators. Dierent values of the average connectivity z are shown. For small
W, cooperators have no chance. Their fate changes as W approaches a critical value
W
critical
| which increases monotonically with connectivity z | cooperators wiping
out defectors above W
critical
(the increase of W
critical
with z is expected, since there
are more links to be rewired; in practice, W
critical
is determined as the value of W at