Information Technology Reference
In-Depth Information
6
Before
cooling
During cooling
After cooling
4
2
A
B
C
D
0
0
5
10
15
20
25
30
35
hours
A
Before cooling
After cooling
4
Combined matrix
1+4
1
0.8
0.6
0.4
0.2
0
1
2+5
100
100
2
200
5
200
200
3
6
400
3+6
300
300
100
200
300
100
200
300
200
400
Burst #
B
C
#1
#2
#3
Before cooling
0
−0.1
−0.1
0
0.1
PC1
After cooling
#4
#5
#6
0.1
0
10 sec.
0
0.1
PC1
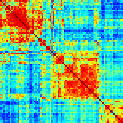
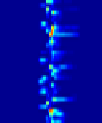
Fig. 12.8. Inhibition of activity and preservation of network motifs during hypothermia. Top: A plot
of the burst rate of the network before, during and after hypothermia stimulation. Dashed lines
mark the onset (left) and offset (right) of stimuli. Bottom
:
Classification of SBEs from before and
after hypothermia. (A) Inter-SBEs correlation matrices where calculated for two data sets
consisting of 300 SBEs taken from before hypothermia and 300 SBEs taken from 5 h after
hypothermia. Clustering analysis was then applied over the two correlation matrices. The resulting
clustered matrices show a clear separation of the data into three sub-groups that contain high values
of correlation. Areas of the matrix in between the three sub-groups have lower values of
correlation. The third matrix shows the inter-SBEs correlation values as calculated from the
combined data of the six sub-groups identified in the previous matrices. Sub-groups #1 and #4 and
sub-groups #2 and #5 share high values of correlation. (B) PCA plots of the three sub-groups
identified in each of the two clustered matrices. Distinction between SBEs of different sub-groups
is color-coded. After hypothermia the separation between the sub-classes becomes more
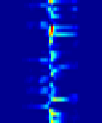
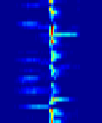
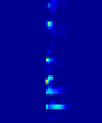
pronounced. (C) Raster plots of the average neuronal activity in each SBE sub-group shown in (A).
Red/blue colors represent high/low spike rate. Figures taken with permission from Rubinsky
et al
.
2007.