Information Technology Reference
In-Depth Information
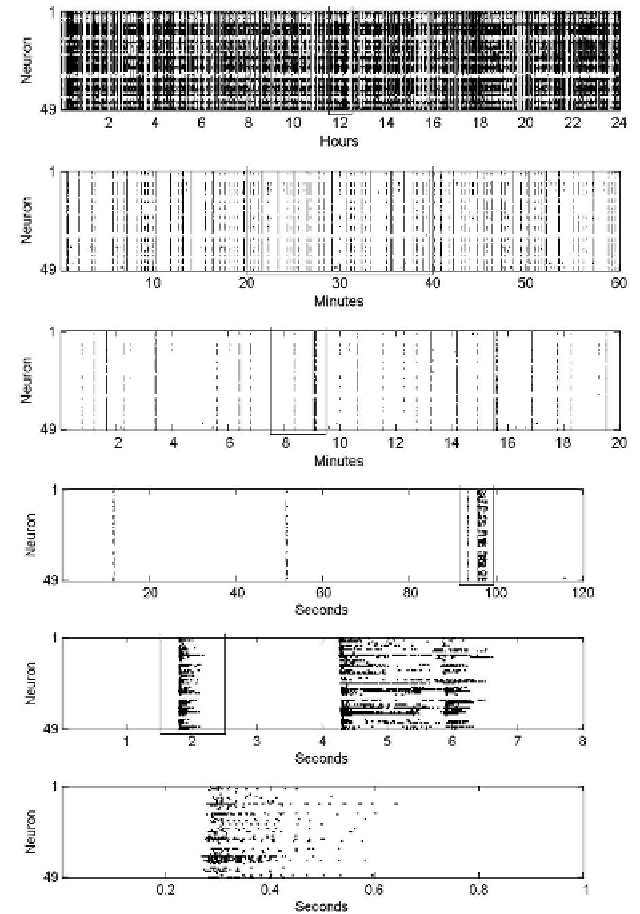
Fig. 12.3. Synchronized bursting events in a recording of a cultured neuronal network. The top
image shows the activity of 49 neurons recorded over 24 hours by a micro-electrode array. Each
row indicates the spikes (black marks) of each of the neurons. Lower images are zoom-ins into
smaller time windows, where each image is an enlargement of a smaller section from its above
image, marked by a rectangle. Synchronized bursting events (SBEs) are distinguished as vertical
lines of intense activity of most of the recorded neurons. The bottom image is of a 1 second
window showing a single SBE.