Information Technology Reference
In-Depth Information
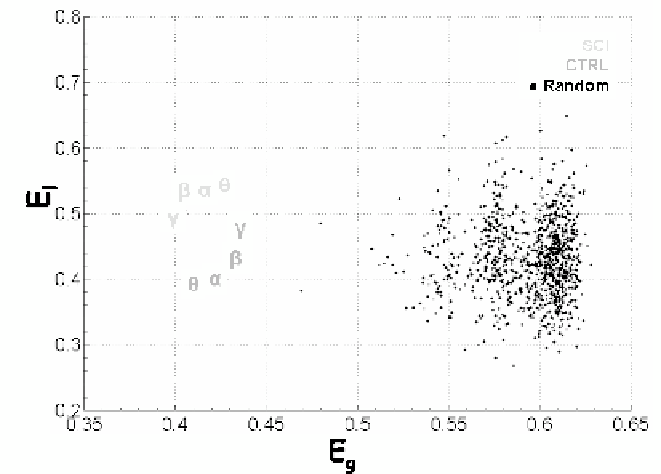
Fig. 10.6. Scatter plot of global- and local-efficiency for SCI networks, CTRL networks and
random networks. The Greek symbol codes the average value in a particular frequency band. Black
dots identify the values from a distribution of 1000 random graphs.
the estimated cortical networks. Figure 10.6 shows the contrast between the
values of global and local efficiency obtained in the two studied populations with
those obtained in a set of one thousand random graphs, having the same number
of nodes and arcs.
Analysis of variance (ANOVA p = 0.05) was used in order to find significant
differences between the indices of efficiency indexes computed in the two groups
(SCI, CTRL) for all the frequency bands (Theta, Alpha, Beta and Gamma).
ANOVA performed on the global-efficiency
E
g
variable showed no significant
differences for the main factors GROUP and BAND. Instead, the ANOVA
performed on the
E
l
variable revealed a strong influence of the between factor
GROUP (F = 32.67, p = 0.00045); while the BAND factor and the interaction
between GROUP X BAND were found not significant (F = 0.21 and F = 0.91
respectively, p values equal to 0.891 and 0.457). Post-hoc tests revealed a
significant difference between the two examined experimental groups (SCI,
CTRL) in Theta, Alpha and Beta band (p = 0.006, 0.01, 0.03 respectively). It can
be observed (Fig. 10.6) that the average values of the local efficiency in the SCI
subjects are significantly higher than those obtained in the CTRL group, for these
three frequency bands. The higher value
of local efficiency
E
l
implies that the
network tends to form clusters of ROIs which hold an efficient communication.