Information Technology Reference
In-Depth Information
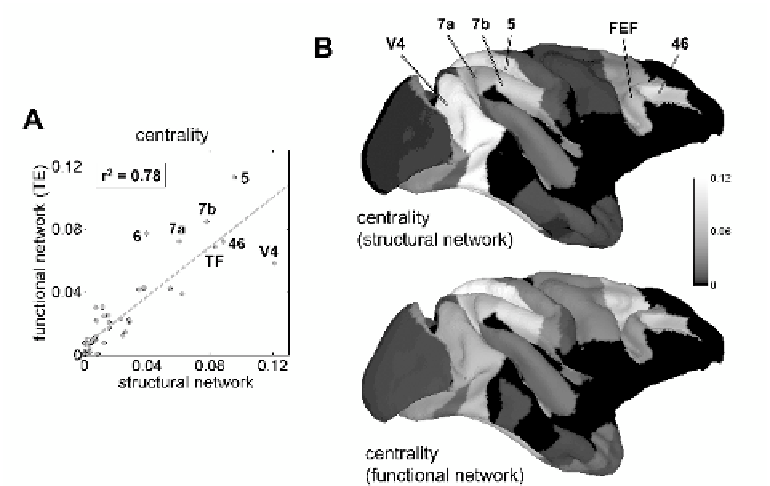
Fig. 9.4. Network measures of structural and functional networks are closely correlated (data
replotted from Honey
et al
. 2007). These data are derived from a simulation study of the macaque
visual and somatomotor cortex. Structural connections were obtained from a neuroanatomical
database and functional connections were derived from long-time samples of nonlinear simulations
of endogenous neural activity within this graph. The centrality of nodes in the structural and
functional network is highly correlated (for a scatter plot, see A; for a distribution of centrality on
the macaque cortical surface, see B).
of functional microstates. Slow variations in the statistics of synchronous
coupling gave rise to changes in the strengths of directed interactions between
regions at a time scale of seconds (Fig. 9.5). The model suggested that
spontaneous cortical dynamics exhibit ongoing changes in the pattern and
strengths of functional coupling, and that these coupling events are in turn related
to the amplitude of the simulated fMRI response. Thus, functional connectivity
patterns exhibit rich and complex spatiotemporal structure at multiple scales.
Importantly, these rich dynamics can result even while structural couplings
remain constant across time.
Other large-scale models that are capable of relating structural and functional
connectivity have been implemented. For example, models of the
synchronization dynamics within the cat cortex have revealed significant overlap
in clustered synchronization behavior and structurally defined clusters of brain