Information Technology Reference
In-Depth Information
1.8
1.6
1.4
1.2
1
0.8
0.6
0.4
0
0.2
0.4
0.6
0.8
1
1.2
1.4
T
1
0.9
0.8
0.7
0.6
0.5
0.4
0
0.2
0.4
0.6
0.8
1
1.2
1.4
T
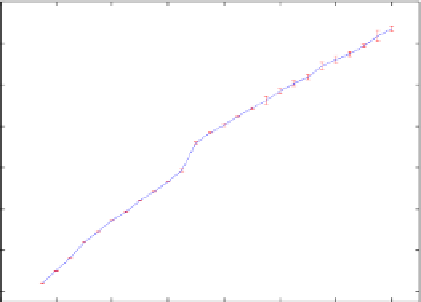
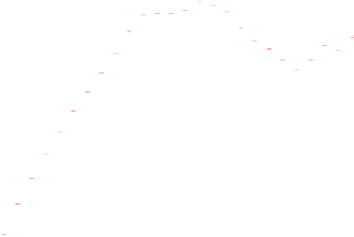
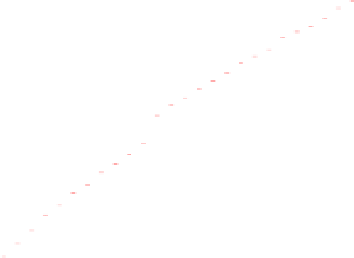
As in Fig. 6.9 for the homopolymer S
4
h
and the proteinlike sequence S
4
g
.
Fig. 6.10.
which develops a sharper peak, consistently with the fact that the system is closer
to the situation where a thermodynamic -transition exists.
As to the other sequences, for the bad folder S
2
b
, (T) is not as smooth as
for the homopolymers, but only a very weak signal is found at T'0:4, lower
than T
; below this temperature the systems seems to behave as a glass. For the
\intermediate" sequence S
2
i
a peak is present at the \quasi-folding" temperature,
although considerably broader than in the case of S
2
g
(see Fig. 6.11).
Where does the peak in (T) near T
f
come from? As shown in [25] one can argue,
using an analysis of the behavior of the curvature along the dynamical trajectories,
that it is due to the presence of two macroregions in the energy landscape, one
corresponding to the native state and the other|charatcterized by a smaller average
curvature|corresponding to the unfolded state. Then the dynamics is eectively
two-state: close to T
f
, the system often jumps between the two basins and this
explains the growth of the uctuations of K
R
.