Information Technology Reference
In-Depth Information
10
rank
1
0.01
0.1
l
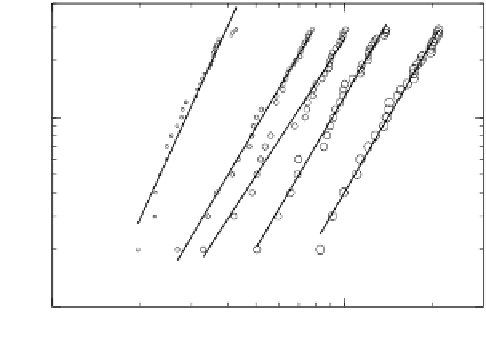
Fig. 6.6. Rank{to{eigenvalue plot for the discrete Laplacian matrix of the slow-folding het-
eropolymer for ve dierent temperatures: T = 0:00; 0:02; 0:04; 0:06; 0:08. Increasing circle size
corresponds to increasing temperature. Continuous lines refer to power{law least square ts of
exponents 3.3, 2.4, 2.2, 2.2 and 2.05, respectively.
10
rank
1
0.01
0.1
l
Fig. 6.7. Rank{to{eigenvalue plot for the discrete Laplacian matrix of the fast{folding heteropoly-
mer for ve dierent temperatures: T = 0:00; 0:02; 0:04; 0:06; 0:08. Increasing circle size corre-
sponds to increasing temperature. Continuous lines refer to power{law least{square ts of expo-
nents 3.4, 2.6, 2.4, 2.6 and 2.6, respectively.
shortest{path from from the minimal energy node (here not very rigorously, yet
reasonably, considered as the center of the graph), decreases rather smoothly in the
temperature range considered, further conrming that the observed eect depicts a
genuine topological change and is not due to the limited system size.
The early drop in the spectral dimension that we observe implies that much of
the dimensionality of the system lies in those subnetwork that collapse on a single
node at very low temperatures. The corresponding nodes represent the minima
of the potential energy separated by the smallest activation barriers. The energy