Environmental Engineering Reference
In-Depth Information
Considering that
P
α
in the nucleation experiments is normally not far from 1 atm and Δ
P
for the
critical drop is higher essentially we can put
P
β
≅ Δ
P
. To know the Debye frequency as a function of
pressure it is enough to know the dependence of sound velocity on pressure (see Equation 19.62) (the
density ρ
β
is a very weak function of pressure). In Ref. [48] the sound velocity of liquid Cs was mea-
sured in the range of temperatures 300-1500 K and pressure 2 × 10
6
− 6 × 10
7
Pa. The experimental
measurements can be approximated by the following empirical function:
2
))
.
0 1
u
(
m s
/ ≈
)
1.475 10 ( Pa)
×
P
(
+
P T
0
(
(19.66)
where
P
0
= (7.35, 6.78, and 6.10) × 10
7
Pa for temperatures 508, 530, and 554 K, respectively. For
the irst iteration we set the pressure to be 1 atm (1.013 × 10
5
Pa), then, using the density of liquid
Cs from Table 19.1 and Equations 19.66 and 19.62 we get
u
= 903, 895, and 886 m/s and ν
max
=
(1.80, 1.79, and 1.77) × 10
12
s
−1
for
T
= 508, 530, and 554 K, respectively.
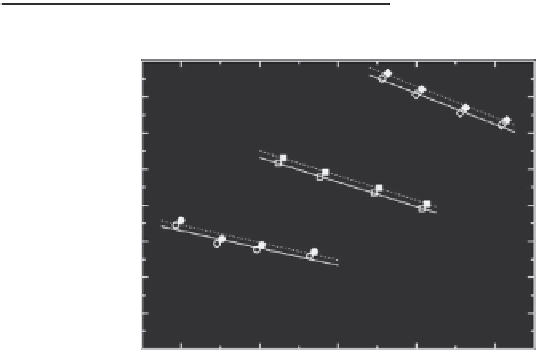
The joint solution of Equations 19.61, 19.62, and 19.64 is shown in Figure 19.4 as ln(σ
S
/σ
∞
) ver-
sus ln
R
S
. The Tolman length δ can be determined solving the GTKB differential equation (19.5)
which contains
d
ln (σ
S
(
R
S
)/σ
∞
)/
d
ln(
R
S
) in the LHS and the RHS contains only δ/
R
S
. One can see
from Figure 19.4 that within the experimental accuracy the dependence ln(σ
S
(
R
S
)/σ
∞
) on ln(
R
S
)
can be approximated by a linear function with a constant slope
d
ln(σ
S
(
R
S
)/σ
∞
)/
d
ln(
R
S
) = −0.240,
TABLE 19.1
Important Parameters for Liquid Metals Used in Calculations
Metal
T
0
(
K
)
ψ
(Dyne/cm/K)
C
D
(K)
ρ
(g/cm
3
)
κ
(cm
2
/Dyne)
Li
3300
0.140
8.00
8120
0.47
1.0 × 10
−11
Na
2350
0.100
7.70
5460
0.87
2.3 × 10
−11
Cs
1790
0.048
7.25
3920
1.75
7.0 × 10
−11
Ag
6980
0.161
8.92
14464
9.35
1.4 × 10
−12
Hg
2540
0.210
8.04
3215
12.8
3.8 × 10
−12
Mg
3128
0.254
8.80
7674
1.59
5.1 × 10
−12
Zn
5430
0.167
8.35
6400
6.75
1.9 × 10
−12
0.37
554 K
Cs
0.36
0.35
530 K
0.34
0.33
T
= 508 K
0.32
0.31
0.30
0.29
0.28
0.30
0.32
0.34
0.36
In
R
s
(nm)
FIGURE 19.4
ln(σ
S
/σ
∞
) versus ln
R
S
as calculated by solution of Equations 19.61 and 19.64 using the experi-
mental measurements of the nucleation rate from the vapor of Cs (Figure 19.3). Open and illed symbols are
results of the irst and second iterations, respectively. Lines are linear ittings.


Search WWH ::

Custom Search