Environmental Engineering Reference
In-Depth Information
Exposure
Changes in
particle
size distr.
Box
Airborne
Open air
Breathing
rate
Concentration
Deposition
coefficient
Particle
Uncertainty
Uncertainties
FAL
Surface
area
Intake
Breathing
zone
Biokinetics
parameters
Efficiency
Respirators
Dose
Into cell
penetration
coefficient
Deposition
non-uniformity
Local
dose
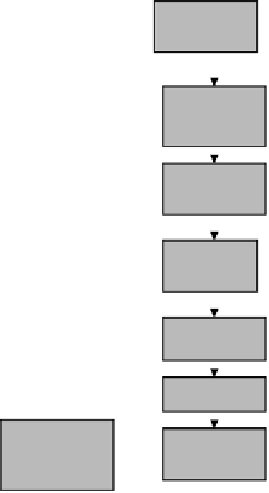
FIGURE 16.1
Road map nanoaerosols dosimetry presents a conceptual mapping of the processes starting
with the manufacture of nanomaterial, through its possible release into the environment and ultimate dose to
the target cell.
nonradioactive aerosols. Figure 16.1 (Ruzer, 2008) depicts the basic processes of radon decay
producing “unattached” and “aerosol attached” activities. According to this igure there should be
some correlation between unattached activity and aerosol concentration. In other words, the smaller
the aerosol concentration, the bigger will be the unattached activity and vice versa. In quantitative
terms, the unattached fraction of radon progeny can be used as a measure of aerosol particle con-
centration. This is the basis for the approach proposed in Ruzer (1964a,b) for measuring very small
aerosol concentrations.
In the following, we present the details and calibration procedure for unattached fraction
measurement.
16.2.5 M
etHod
and
c
alibration
P
rocedure
The method and calibration procedure for measurement of radon progeny unattached fraction is
presented in Ruzer and Sextro (1997). The equipment for calibration and measurement of unattached
and attached radon progeny consists of the following:
1. A chamber with regulated concentration of the unattached fraction of radon decay products
in the range from 0, to close to 0.95-1.0 (note that a high aerosol concentration, >10
6
particles/cm
3
, creates surface for diffusion of nearly all unattached fraction, while a very
low aerosol concentration will remove almost none of the attached fraction).
2. An alpha-spectrometer.


Search WWH ::

Custom Search