Environmental Engineering Reference
In-Depth Information
0
10
20
30
40
d
(nm)
50
60
70
80
FIGURE 11.5
Typical diameter distribution for ibuprofen nanoparticles (as measured by the aerosol
spectrometer).
Nanoparticles
Original substance
5
10
15
20 25
2θ (degrees)
30
35
40
45
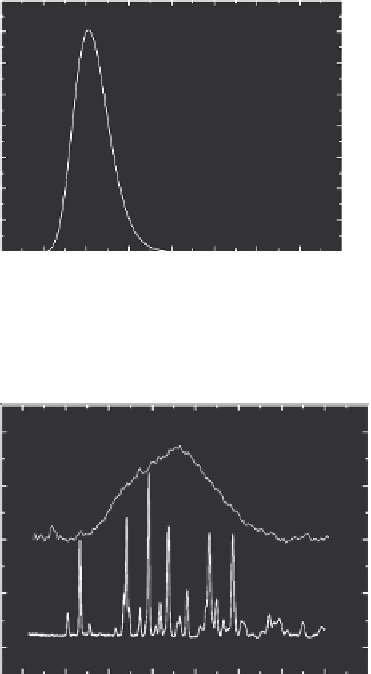
FIGURE 11.6
Comparison between the chromatograms of original ibuprofen powder and nanoparticles
(mean particle diameter
d
= 85 nm) formed by evaporation-nucleation.
ibuprofen were identical to that from the original powder. Thus, one may suppose that the nanopar-
ticles are chemically identical to the original substance.
The crystal phase analysis of nanoparticles was carried out using x-ray diffractometer system
Bruker-AXS D8 Discover with GADDS Area Detector. The powder x-ray diffraction patterns of
indomethacin nanoparticles and γ indomethacin original powder are compared in Figure 11.6. The
XRD pattern of nanoparticulate material contains a broad halo uncorrelated with the crystalline
peaks, which is typical for the amorphous indomethacin (Hermsdorf et al., 2007). Thus, the evapo-
ration-condensation route results in the formation of amorphous nanoparticles.
The powder x-ray diffraction patterns of ibuprofen nanoparticles and original powder are com-
pared in Figure 11.7. Both XRD patterns from nanoparticles and original substance correspond
to racemic ibuprofen (Stahly et al., 1997; Hermsdorf et al., 2007; Lee et al., 2008), that is, the
nanoparticles form the same crystal phase as the original substance. The small difference in the
peak relative intensities between the curves a and b in the range of 17 < 2θ < 21 is probably related
to the difference in distribution of crystallographic orientations in the micro-sized original powder
and nanoparticles.
11.1.2.2 Lung-Deposited Dose
To determine the lung-deposited dose, we measured the fraction α of particles consumed per cham-
ber due to mouse breathing:
Search WWH ::

Custom Search