Environmental Engineering Reference
In-Depth Information
400
300
200
100
0
5
6
7 8 9 10
20
30
40
50 60 70 8090100
200
300
Particle diameter (nm)
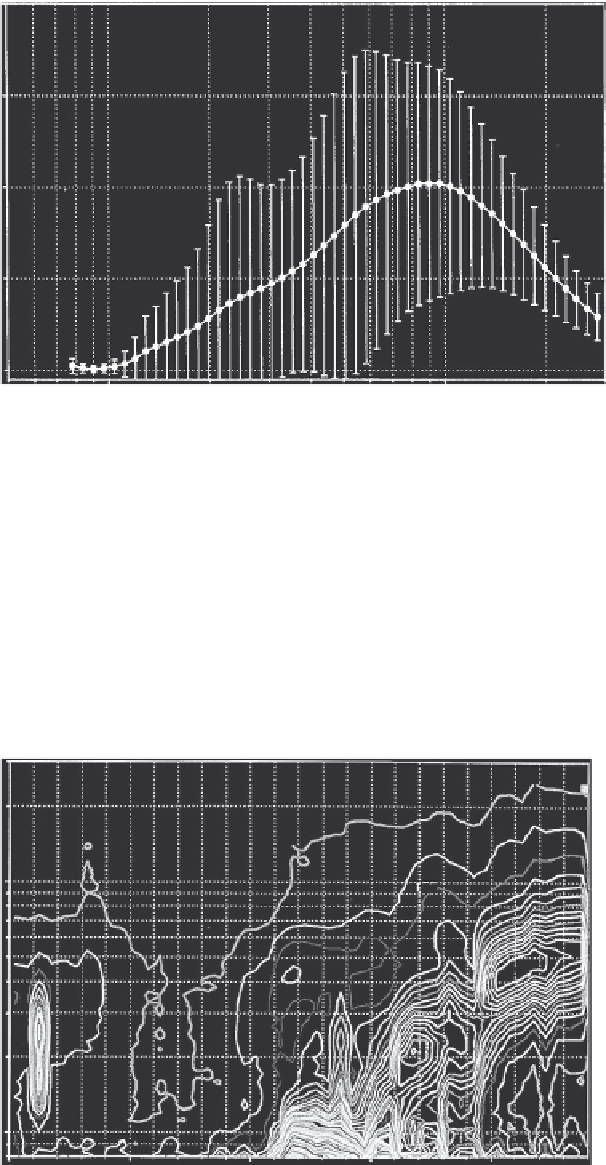
FIGURE 8.3
Average particle size distribution (mean and standard deviation) collected for 7 days (July
14-21, 1999) in Tuxedo, NY. Standard deviation represents the variability of the number detected by sampling
every 30 min (NIEM outdoor, SMPS: sampling every 30 min, three scans per sample).
Nucleation events in the atmosphere in which large concentrations of nanometer-sized particles
form and grow over a period of hours occur about one quarter of the days per year. Concentrations
of particles smaller than 50 nm can be increased by a factor of 10 or more when nucleation occurs.
A nucleation event is shown in Figure 8.4, which displays the development of the particle number
concentration over 24 h at a rural location in New York.
Particle concentration (cm
−3
) on october 25, 1999
300
200
50
100
100
150
6
7
8
90
50
750
40
30
550
850
20
5500
10
0 1 2 3 4 5 6 7 8 9 10 11 12 13 14 15 16 17 18 19 20 21 22 23 24
Time (h)
FIGURE 8.4
Nucleation event showing the development of a very high concentration of particles less than
10 nm. The contours are lines of equal particle concentration in particles cm
-3
. The interval between contours
is 50 particles cm
-3
.
Search WWH ::

Custom Search