Environmental Engineering Reference
In-Depth Information
11.4
29.5
9.2
Cleaning
6
2 min, walk/sit
4 people, 5 min
4 people, 30 min
Walk in
4
2
0
0.5 - 1
1 - 5
Particle diameter (µm)
5 - 10
10 - 25
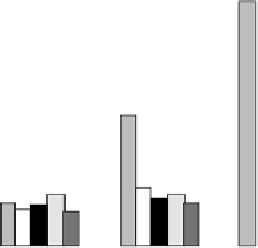
FIGURE 6.16
Ratios of suspended particle concentrations after human activities to concentrations before
activity in a single-family residence. (From Thatcher, T.L. and Layton, D.W.,
Atmos. Environ
., 29, 1487, 1995.)
These deposition rates are a combination of deposition due to diffusion (more important for
small particles) and that due to gravitational settling (more important for large particles). For a
horizontal, upward facing surface, the two deposition mechanisms are about equal for ∼0.2 μm
diameter, unit-density spheres. In contrast, diffusion is about 400 times more important for 0.01 μm
particles, while settling is about 60 times more important for 1 μm particles (Hinds, 1999, p. 162).
There are also effects due to the turbulence of the air within the enclosure, as reported by Lewis
(1995), Xu et al. (1994), and Thatcher et al. (2002), and as shown in Figure 6.16.
Thus, the indoor aerosol dynamics depends strongly on both particle size and surface orientation.
These differences may also have important implications for depositional losses in building leaks,
depending upon the low rates and particle velocities.
6.5.4 r
esusPension
r
ate
oF
P
articles
on
c
arPets
/F
loors
Only limited data are available on the rates with which particles on loors are suspended into air
(expressed as a fraction of particulate loading on loor surfaces suspended per unit time) by human
activities. Early work on resuspension indoors focused on the movement of radionuclides from loors
to air. Healy (1971) developed a time-weighted-average resuspension rate of 5 × 10
−4
h
−1
for a house.
This is comparable to the value of Murphy and Yocom (1986), who selected a value of 10
-4
h
−1
.
Measurements of particles in indoor air using optical particle counters demonstrate that resuspension
is a function of human activities as well as particle size. Kamens et al. (1991), for example, showed
that the increase in suspended particles over the course of a day in a house corresponded to the
activities of the residents. The apparent resuspension threshold of particles from loor surfaces is
about 2 μm (Thatcher and Layton, 1995). The study of Clayton et al. (1993) supports this relationship.
They found that the concentrations of ine particulate matter (i.e., particles under 2.5 μm in diameter)
in the main living area of a sample of houses were highly correlated with the outdoor levels recorded
at ixed monitors; however, the PM
10
concentrations only had a correlation coeficient of only 0.37
with ixed-site monitors. This suggests that a signiicant portion of the PM
10
particles collected were
suspendable particles over 2 μm in diameter derived from human activities. The resuspension rates
increase signiicantly with aerosols larger than ∼2 μm, as illustrated in Figure 6.16.
The mass loadings of soil/dust on loors in the literature vary from 0.136 to 0.870 g m
−2
. The geometric
mean of the mass loadings is 0.42 g m
−2
with a geometric standard deviation of 1.88. Most of the data on
dust loadings are based on studies dealing with lead contamination of the indoor environment (see, for
example, Gulson et al., 1995). The mass loading of particulate matter on carpets/loors represents the
mass available for resuspension of particles into indoor air. Floor dust also serves as a contact medium
for infants/toddlers who crawl on loors and have hand-to-mouth behaviors that result in the ingestion
of dusts. An unresolved issue is the relative suspendability of particles on carpets versus bare loors.


Search WWH ::

Custom Search