Environmental Engineering Reference
In-Depth Information
Seattle
Boston
New York
Detron
Chicago
Pittsburgh
Philadelphia
Denver
Riverside
St Louis
Phoenix
Los
Angeles
Atlanta
Birmingham
Houston
Max.
24
Min.
Total mas
s
(
μg/m
-3
)
Sulfate
Nitrate
Elemental carbon
6
Organic carbon
Crustal
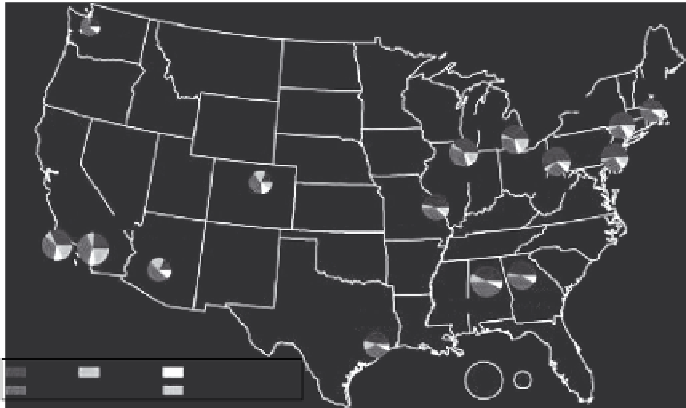
FIGURE 6.1
Average annual PM
2.5
concentrations for urban areas of the United States in 2008. The diameter
of each pie icon scales with its PM concentration. Major PM constituents start with nitrate at the 3 o'clock
position and continue clockwise in the order nitrate, elemental carbon, organic carbon, crustal species, and
sulfate. (From U.S. Environmental Protection Agency, Our Nation's air, status and trends through 2008, Ofice
of Air Quality Planning and Standards, Research Triangle Park, NC, EPA Publication No. EPA 454/R-09-002,
www.epa.gov/airtrends/2010/report/fullreport, 2010.)
areas in the United States for 2008, as reported by the Speciation Trends Network (U.S. EPA,
2010, p. 24). The pie icons show the major constituents of PM
2.5
that are monitored every third day
throughout the United States under the guidance of the EPA: the ions nitrate and sulfate, crustal ele-
ments (aluminum, silicon, calcium, iron, and titanium), and carbonaceous components as elemental
carbon and organic carbon (Rao et al., 2003).
Monitoring over the last decade shows that urban areas experience higher PM concentrations
than rural areas, but the difference is smaller in the eastern United States. East of Denver, Colorado,
sulfate accounts for more of the PM mass than the other constituents, followed by organic carbon,
nitrate, and elemental carbon. Except in the Los Angeles area of California, organic carbon was
the most abundant constituent in the west, followed by sulfate. Figure 6.1 does not show particulate
ammonium, but earlier EPA reports indicate that NH
4
+
is ubiquitous and originates from biogenic
ammonia that reacts with SO
2
and NO
x
(U.S. EPA, 2003). Nationwide differences in ionic compo-
sition can be traced to regional differences in concentrations of gas-phase precursors SO
2
(from
stationary sources like power plants) and NO
x
(primarily from vehicles, western United States).
6.1.3.2 PM
2.5
Source Apportionment
The irst steps in understanding and controlling concentrations of PM
2.5
require identifying the
most important contributors to ine airborne particles and inding out how much each adds to the
atmosphere over time and space. For outdoor air, the process depends on knowledge of the compo-
sition and behavior of particles produced by each source while they are generated, then dilute with
ambient air, and move through the atmosphere. All the while, the source particles are interacting
with other pollutants under varying meteorological conditions, with other local pollutants adding
to regional air masses.
Vehicle exhaust is ubiquitous and usually among the top three contributors to PM
2.5
. Biomass
combustion from residential wood burning, agricultural controlled burns, and forest ires varies
by season and region. Emissions from stationary sources like power plants and coke factories, tire
wear, plant detritus, spores, halogenated organic compounds from pesticides, PCBs and dioxin-like
Search WWH ::

Custom Search