Environmental Engineering Reference
In-Depth Information
associating individual airways of a branching lung morphology model with speciic voxels of a cor-
responding SPECT image, thereby allowing for the comparison of simulated deposition with actual
deposition measurements.
Some CFPD studies have also compared local deposition patterns with experimental data. Isaacs
et al.
63
created a CFPD model of a tracheal bifurcation, based on the geometry of the cast system
of Schlesinger et al.
296
Modeled particle deposition results in the localized “hot spot” region of the
bifurcation were favorably compared with the experimental results obtained in the cast.
5.6
APPLICATIONS OF DEPOSITION MODELS
5.6.1 e
xPosure
and
r
isk
a
ssessMent
Aerosol particle deposition models can provide a quantitative estimate of the amount of material
deposited in the lungs under certain conditions. The ability to provide a mechanistic link between
human exposure to pollutants and intake dose received has a potential role in the assessment of risk
associated with inhaled particulate matter. Several stochastic human exposure models developed
and used by the U.S. EPA have recently been updated to incorporate aerosol dosimetry models.
These models include the Air Pollutants Exposure (APEX) model
297,298
of the EPA's Ofice of Air
Quality Planning and Standards and SHEDS-PM,
299
a stochastic exposure model developed by the
EPA's Ofice of Research and Development (ORD).
In both APEX and SHEDS-PM, census and other input data are used to create a simulated popu-
lation of the area being studied (usually a U.S. city, urban area, or state). A year-long time series of
pollutant exposures (the PM concentration being encountered) are then estimated for each simulated
person, based on ambient air quality data, housing characteristics, and human activity data. The
exposure time series are combined with other physiological characteristics of the simulated person
and particle composition information, and used as input to a modiied version of the empirical ICRP
dosimetry model
21
to predict population distributions of deposited particle doses. These dosimetry
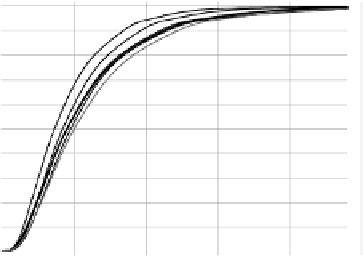
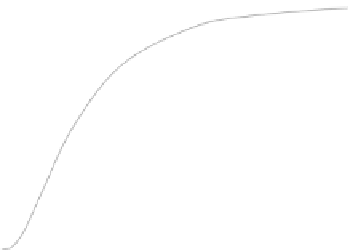
algorithms may be useful in future risk assessments of PM. An example of a population dose distri-
bution curve is provided in Figure 5.18.
Other particle dosimetry models are also being used in other EPA efforts to associate human
pollutant exposures and doses with health effects. The Exposure Model for Individuals (EMI)
300
is
being developed by ORD for use in interpreting individual-level data (e.g., questionnaires) collected in
a number of air pollution cohort health studies. Similar to APEX and SHEDS, EMI also contains an
100
90
80
70
60
50
100
90
80
70
60
50
40
30
20
10
0
All
0-4
5-11
12-17
All
Female
Male
40
30
20
10
0
18-24
25-34
45-54
55-64
35-44
0
100 200
Daily PM
2.5
deposited dose (µg)
300
400
500
0
100
200
300
400
500
(A)
(B)
Daily PM
2.5
deposited dose (µg)
FIGURE 5.18
Distribution of daily deposited PM
2.5
dose in a year-long simulation of a population of 15,358
individuals in Philadelphia, PA, both by gender (A) and age (B). These doses were calculated using the
SHEDS-PM exposure model,
299
incorporating an adapted version of the ICRP deposition algorithm (with no
clearance). These simulations were based on PM
2.5
air quality data for 2008. (Courtesy of Janet Burke, EPA,
Research Triangle Park, NC.)


Search WWH ::

Custom Search