Biomedical Engineering Reference
In-Depth Information
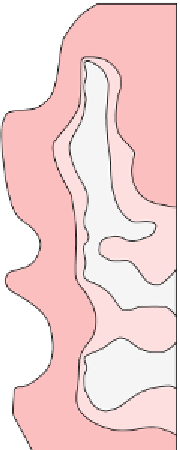
the original bioaugmentation cell (designated here as AMC). Single culture (SC-1) was diluted
to a final TSS of about 2.5 g/L and injected into test cells oxygenated with air (ASC), and
oxygen (OSC), respectively. Figure
10.6
illustrates the MTBE distribution in shallow and deep
wells before (40 days before) and after (up to 275 days after) injection. No evidence of lessening
of MTBE degradation potential was observed over the time periods monitored for any test cell.
In brief, the pilot tests confirmed that the aquifer could be successfully bioaugmented with
no loss of biobarrier activity over time. Concentrations of MTBE were reduced from roughly
Day -40
Day 0
Day 67
90-
90-
90-
W5-
1
5
W5-1
5
W5-
1
5
W1-
9
W2-9
W3-
9
W4-
9
W5-
1
4
W1-
9
W2-
9
W3-
9
W4-
9
W5-1
4
W1-
9
W2-
9
W3-
9
W4-
9
W5-
1
4
80-
80-
80-
W1-
8
W2-8
W3-
8
W4-
8
W5-
1
3
W1-
8
W2-
8
W3-
8
W4-
8
W5-1
3
W1-
8
W2-
8
W3-
8
W4-
8
W5-
1
3
W1-
7
W2-
7
W3-
7
W4-
7
W5-
1
2
W1-
7
W2-
7
W3-
7
W4-
7
W5-1
2
W1-
7
W2-
7
W3-
7
W4-
7
W5-
1
2
70-
70-
70-
W5-
11
W5-1
1
W5-
1
1
OSC
OSC
OSC
60-
60-
60-
W5-
1
0
W5-1
0
W5-
1
0
W5-
9
W5-9
W5-
9
50-
50-
50-
W1-
6
W2-6
W3-
6
W4-
6
W5-
8
W1-6
W2-
6
W3-
6
W4-
6
W5-8
W1-
6
W2-
6
W3-
6
W4-
6
W5-
8
W1-
5
W2-
5
W1-
5
W2-
5
W1-
5
W2-
5
W3-
5
W4-
5
W5-
7
W3-
5
W4-
5
W5-7
W3-
5
W4-
5
W5-
7
40-
40-
40-
W1-
4
W2-4
W3-
4
W4-
4
W5-
6
W1-4
W2-
4
W3-
4
W4-
4
W5-
6
W1-
4
W2-
4
W3-
4
W4-
4
W5-
6
30-
30-
30-
W5-
5
W5-5
W5-
5
ASC
ASC
ASC
W5-
4
W5-
4
W5-
4
20-
20-
20-
W3-
3
W4-
3
W5-
3
W3-
3
W4-
3
W5-3
W3-
3
W4-
3
W5-
3
W1-
3
W2-
3
W1-
3
W2-
3
W1-
3
W2-
3
W3-
2
W4-
2
W3-
2
W4-
2
W3-
2
W4-
2
W1-
2
W2-
2
W5-
2
W1-
2
W2-
2
W5-2
W1-
2
W2-
2
W5-
2
10-
10-
10-
W3-
1
W4-
1
W5-
1
W3-
1
W4-
1
W5-1
W3-
1
W4-
1
W5-
1
W1-
1
W2-
1
W1-
1
W2-
1
W1-
1
W2-
1
0-
0-
0-
A
MC
AMC
A
MC
0
10
20
30
40
50
0
10
20
30
40
50
0
10
20
30
40
50
Day 173
Day 275
90-
90-
W5-
1
5
W5-1
5
W1-
9
W2-9
W3-
9
W4-
9
W5-
1
4
W1-
9
W2-
9
W3-
9
W4-
9
W5-1
4
80-
80-
W1-
8
W2-8
W3-
8
W4-
8
W5-
1
3
W1-
8
W2-
8
W3-
8
W4-
8
W5-1
3
5
W1-
7
W2-
7
W3-
7
W4-
7
W5-
1
2
W1-
7
W2-
7
W3-
7
W4-
7
W5-1
2
70-
70-
W5-
11
W5-1
1
OSC
OSC
60-
60-
W5-
1
0
W5-1
0
W5-
9
W5-9
50-
50-
W1-
6
W2-6
W3-
6
W4-
6
W5-
8
W1-6
W2-
6
W3-
6
W4-
6
W5-8
0.5
W1-
5
W2-
5
W3-
5
W4-
5
W1-
5
W2-
5
W3-
5
W4-
5
W5-
7
W5-7
40-
40-
W1-
4
W2-4
W3-
4
W4-
4
W5-
6
W1-4
W2-
4
W3-
4
W4-
4
W5-
6
30-
30-
W5-
5
W5-5
ASC
ASC
W5-
4
W5-
4
0.05
20-
20-
W3-
3
W4-
3
W5-
3
W3-
3
W4-
3
W5-3
W1-
3
W2-
3
W1-
3
W2-
3
W3-
2
W4-
2
W3-
2
W4-
2
W1-
2
W2-
2
W5-
2
W1-
2
W2-
2
W5-2
10-
10-
W3-
1
W4-
1
W5-
1
W3-
1
W4-
1
W5-1
W1-
1
W2-
1
W1-
1
W2-
1
0-
0-
A
MC
AMC
0.005
0
10
20
30
40
50
0
10
20
30
40
50
Figure 10.6. Time lapse MTBE concentration snapshots illustrating bioaugmentation behavior.
Note that no real difference in bioattenuation observed in all test cells until 6 months have passed.


Search WWH ::

Custom Search