Biomedical Engineering Reference
In-Depth Information
865.0
864.5
864.0
863.0
863.5
862.5
862.0
861.5
861.0
860.5
860.0
859.5
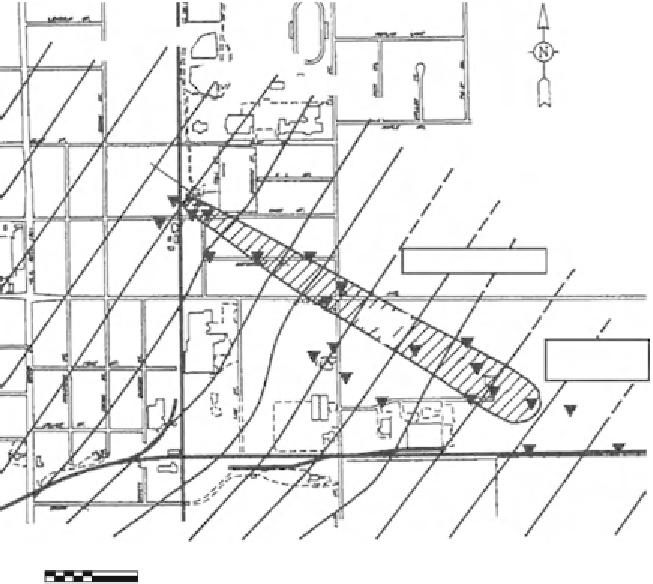
Site of pilot study
859.0
Plume
A
Site of full
scale study
Legend
Monitoring well
Groundwater contour
0 500 1000
Scale in Feet
1” = 1000'
Figure 9.11. Schoolcraft Plume A: site of pilot- and demonstration-scale tests of bioaugmentation
with P. stutzeri KC.
Table 9.3. Chemical and Physical Characteristics of Aquifer Sediments at the Schoolcraft, Michi-
gan Site {Min-Max (Median)}
Shallow Zone
Middle Zone
Deep Zone
Depth bgs (m)
9-15
15-21
21-27
Sediment class
a
Fine sand
Medium sand
Coarse sand, gravel,
coal
Hydraulic conductivity
a
(cm/second [s])
0.0040-0.038 (0.012) 0.0011-0.063 (0.027) 0.019-0.11 (0.046)
Velocity
b
(cm/day)
6.45
14.53
24.74
Sorbed phase CT
c
(
m
g/kilogram [kg])
Nd
2
-15.7 (3.39)
Nd
2
-24.1 (6.50)
Nd
2
-47.6 (12.7)
Aqueous phase CT
d
(
g/L)
2.30-25.6 (5.6)
4.89-27.6 (8.08)
6.46-46.5 (18.0)
m
K
d
(L/kg)
0.012-0.529 (0.145)
0.015-1.17 (0.165)
0.080-3.44 (0.353)
Retardation factor
e
(CT)
1.06-3.56 (1.70)
1.07-6.67 (1.80)
1.39-17.68 (2.70)
Aqueous phase nitrate
d
(mg/L)
13.4-57.3 (40.2)
22.9-58.8 (42.0)
1.87-63.7 (41.0)
a
The sediment class, hydraulic conductivity, and sorbed phase CT values are based on analysis of the cores collected
from the even numbered delivery wells (D2-D14)
b
Calculated from average K in each layer. Bulk velocity is 15 cm/day
c
Nd ¼ below detection limit (Detection limit (LD) ¼ 0.083
m
g/kg, critical level (LC) ¼ 0.043
m
g/kg)
d
The aqueous phase concentration statistics are based on all aqueous phase samples collected from the observation
well grid prior to system operation (November 7, 1997)
e
Calculated from K
d
assuming porosity of 0.33 and bulk density of 1.6


Search WWH ::

Custom Search