Biomedical Engineering Reference
In-Depth Information
followed by the injection of air for 28 days at a rate of 28 L per minute. The inoculation volume
of 676 L was small compared to the estimated volume of TCE-contaminated water of 3.8 10
4
to 5.6
10
4
L within a 7.6 m radius of the injection well.
Following injection, plate count analysis demonstrated that the microorganisms were
distributed 6.1-7.6 m from the injection well (fracture well), and cell numbers in groundwater
from monitoring wells ranged from 10
7
to 10
8
CFU/mL, below the target level of 5
10
8
CFU/
mL. The microbial concentration decreased with radial distance from the injection well.
Average TCE concentrations decreased from 20 to 30 mg/L to less than 5 mg/L within several
days of injection. Rates of TCE transformation decreased over a 2 week period and were
consistent with a decrease in ENV435 numbers. An estimated 825 g of TCE was transformed by
approximately 46,000 g of wet ENV435 cells, corresponding to a transformation capacity on a
wet cell basis of 0.018 mg TCE/mg cells. This value is in the range of the transformation
capacity reported by Chang and Alvarez-Cohen (
1995
). The study demonstrated a novel
approach of combining bioaugmentation with pneumatic fracturing.
8.4.1.5 Bioaugmentation with
Ralstonia eutropha
KT1
A field study was conducted of the bioaugmentation of
Ralstonia eutropha
KT1 in a TCE-
contaminated aquifer in Kururi, Kimitsu City, Chibe, Japan (Tani et al.,
2002
). Groundwater at
the site was contaminated with TCE at a concentration of approximately 200
m
g/L. The
bioaugmented bacteria were monitored using
in situ
PCR targeting the phenol hydroxylase
and by fluorescent
in situ
hybridization (FISH) using 16S ribosomal ribonucleic acid (rRNA).
Bioaugmentation was carried out by injecting 7,000 L of cell suspension at an optical density of
1.0 at 600 nm. Prior to bioaugmentation, the total cell concentration in the groundwater was 3
10
5
cells/mL, and the amount carrying the phenol hydroxylase gene of
R. eutropha
was about
0.1% of the total bacteria. The concentration of bacteria carrying the phenol hydroxylase gene
in groundwater samples taken 1 h after injection was approximately 3
10
7
cells/mL using
in situ
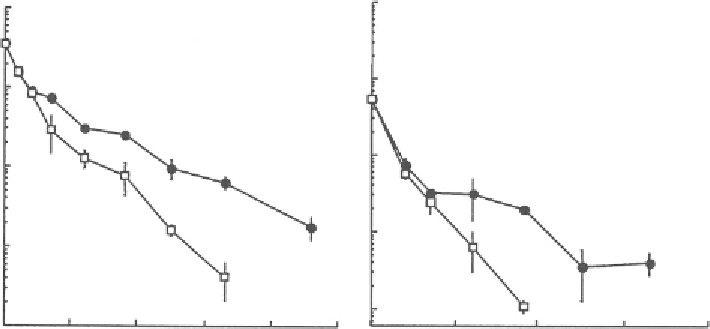
PCR and was similar using FISH (Figure
8.4
). The numbers of bacteria with the phenol
10
8
10
8
W1
W2
10
7
10
7
10
6
10
6
10
5
10
5
10
4
10
4
0
10
20
30
40
50
0
10
20
30
40
Days
Figure 8.4. Changes in the number of bacteria carrying the phenol hydroxylase gene (
) detected
by in situ polymerase chain reaction (PCR) and Ralstonia eutropha KT1 (
□
) detected by fluores-
cence in situ hybidization (FISH) in W1 and W2 during in situ bioaugmenation of Ralstonia
eutropha KT1 (from Tani et al.,
2002
).
Search WWH ::

Custom Search