Graphics Reference
In-Depth Information
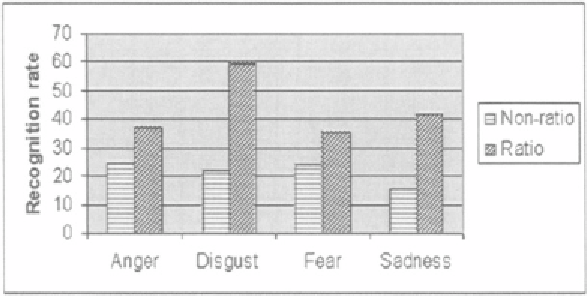
Figure 7.5.
Comparison of the proposed appearance feature (ratio) with non-ratio-image based
appearance feature (non-ratio) in person-independent recognition test.
we first compare the performances of using geometric feature only and using
both geometric and ratio-image-based appearance features. The results are
shown in the rows (a) and (b) of Table 7.5. It can be observed that improvement
is less significant than that in the first experiment. This is mainly due to the
individual variations in facial expressions. Then, We test the performance of
the proposed online EM-based adaptation algorithm. Only the models of the
four easily confused expressions are adapted. In each test, we apply PCA to
the training data. The first 11 principal components are selected which account
for about 90% of total variations. The adaptation is online and unsupervised,
without using the labels of the adaptation data. We choose for fast
adaptation because the amount of the adaptation data is limited. The recognition
rates the adaptation are shown in the row (d) of Table 7.5. We can see the
adaption algorithm improves the recognition rates. For comparison, we also
show in the row (c) the recognition rates of adaptation without the PCA subspace
constraints. It can be seen that the unconstrained adaptation is not stable. The
performance with unconstrained adaptation could sometimes be worse than
performance without adaptation. Figure 7.6 gives a more intuitive comparison
of the four methods.
To test the proposed method under large 3D rigid motions and novel lighting
conditions, we also collect two video sequences of a subject who is not in the
training database. The frame size of the videos is 640
×
480. The first video
has 763 frames and contains substantial global face translation and rotation.
The second video has 435 frames and is taken under a lighting condition dra-
matically different from the rest of data. We manually label the image frames
using the seven categories as the ground truth. Two snapshots for each sequence
are shown in Fig. 7.7 and 7.8. The corresponding recognition results are also

Search WWH ::

Custom Search