Graphics Reference
In-Depth Information
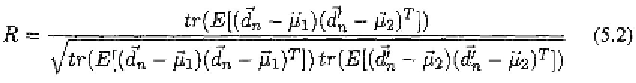
The Pearson product-moment correlation coefficient R between the ground
truth
and the estimated data
is calculated by
where and In our experiment‚ R = 0.952 and MSE =
0.0069 for training data‚ and R = 0.946 and MSE = 0.0075 for testing data.
5.2.3 Animation result
The whole speech-driven 3D face animation procedure contains three steps.
First‚ we extract audio features from the input speech stream‚ as described in
Section 5.2.1. Then‚ we use the trained neural networks to map the audio
features of an audio frame into the visual features (i.e. MUPs). Finally‚ we
use the estimated MUPs to animate a personalized 3D face model in iFACE‚
to which the MUs have been adapted using methods described in Section 5 of
Chapter 3. A typical animation sequence is presented in Figure 5.9.
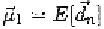
Figure 5.9.
Typical frames of the animation sequence of “A bird flew on lighthearted wing.”
The temporal order is from left to right‚ and from top to bottom.
Our real-time speech driven animation can be used in real-time two-way
communication scenarios such as videophone‚ immersive conferencing in vir-
tual environments [Leung et al.‚ 2000]. On the other hand‚ existing off-line
speech driven animation (e.g. “voice puppetry” [Brand‚ 1999]) can be used in
one-way communication scenarios‚ such as broadcasting‚ advertising. Our ap-
proach deals the mapping of both vowels and consonants‚ thus it is more accurate
than real-time approaches with only vowel-mapping [Kshirsagar and Magnenat-
Thalmann‚ 2000‚ Morishima and Yotsukura‚ 1999]. Compared to real-time


Search WWH ::

Custom Search