Geography Reference
In-Depth Information
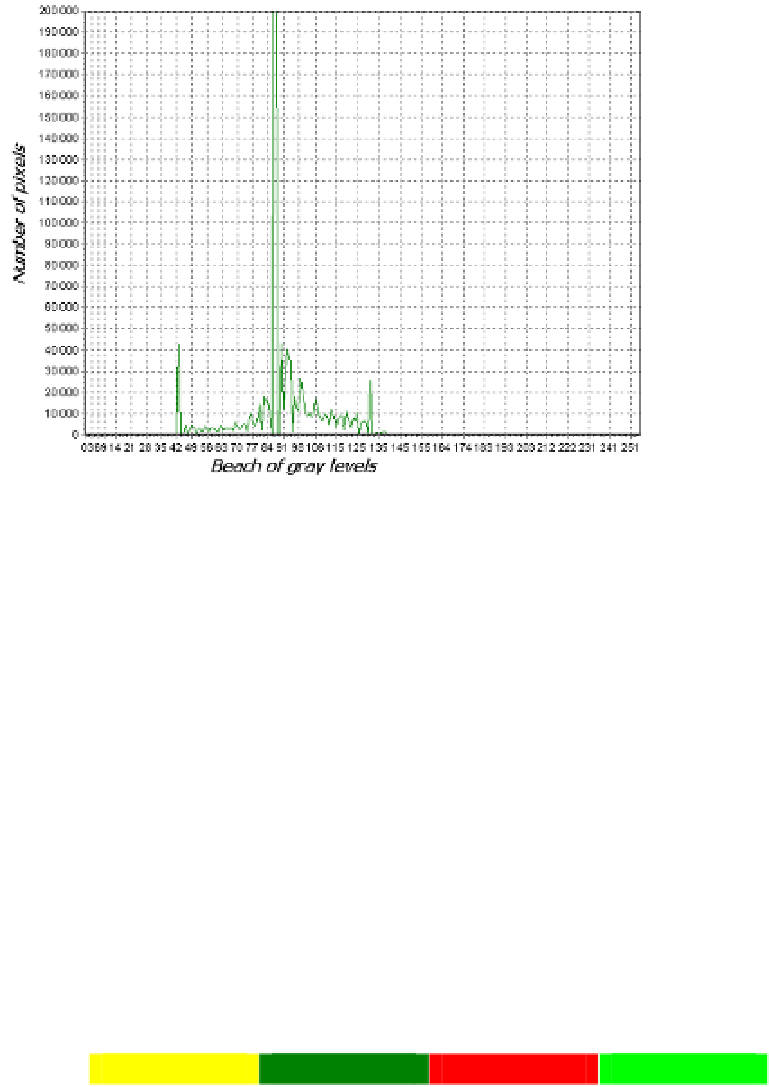
Figure 13.
Corresponding signature of the texture image histogram
The image texture enhances the visual interpretation. Indeed, it contains information on the
spatial distribution of color variations. This is observed in the texture image by the presence
of dark shades, clear, smooth and gray. The texture image obtained does not allow
partitioning of the image into separate classes because its histogram (Figure 7 or 11) does
not present specific modes and valleys. It is again transformed using the histogram. This
second representation offers the advantage of facilitating the visualization of local maxima
and minima. Each representation has them peculiarities and shortcomings; however, the
combined use of two methods of representation facilitates the detection thresholds for
classification (Tables 2 and 3).
Table 3 shows the modes and valleys that were used in classification thresholds. It was
obtained following the same methodological approach followed with the image data of the
mangrove area.
Thresholds / Color codes
Modes
43
87
99
131
Color codes
Valleys
55
90
97
103
Color codes
Table 3.
Detection thresholds for classification and color coding of thematic classes: case of Mount
Cameroon region