Geography Reference
In-Depth Information
11. Signatures (Figures 12 and 13) corresponding to each of the histograms are also
immediately followed. It is interesting to note that the texture image was obtained from the
parameter “Mean” with a window of size 5x5. These parameters were got after several
experimental tests.
Thresholds / Color codes
Modes
38
50
76
89
115
153
172
Color
codes
Valleys
45
57
83
96
121
137
179
Color
code s
Table 2.
Detection thresholds for classification and color coding of thematic classes: case of mangrove
region
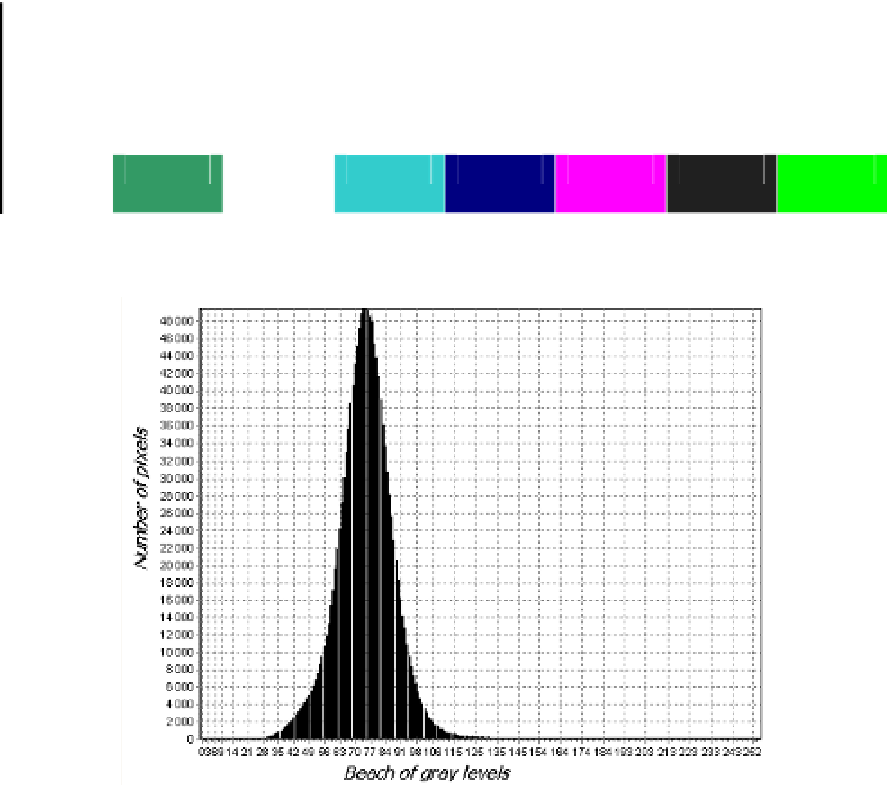
Figure 10.
Filtered image histogram illustrating the presence of one main class of intensity in the image
of Mount Cameroon region.
It can be seen visually that the histogram of the image filtered even not enough to make a
good partition of the base image (Figures 6 and 10). This explains the poor performance of
these filters in scenes that contain fine structures such as lineaments, which are generally not
well preserved by these filters. Similarly, the histogram of the filtered image does not favor
the detection of local extrema accurately. To remedy this shortcoming, a proposal method
for modifying the histogram is implemented. It consists of a transformation of the
representation of the histogram of the SAR image. For this, a histogram of the envelope
curve passing through the ends of each peak is plotted (Figures 7 and 11) using the method
of least squares regression. To keep up the properties of both representations, we plan to