Geography Reference
In-Depth Information
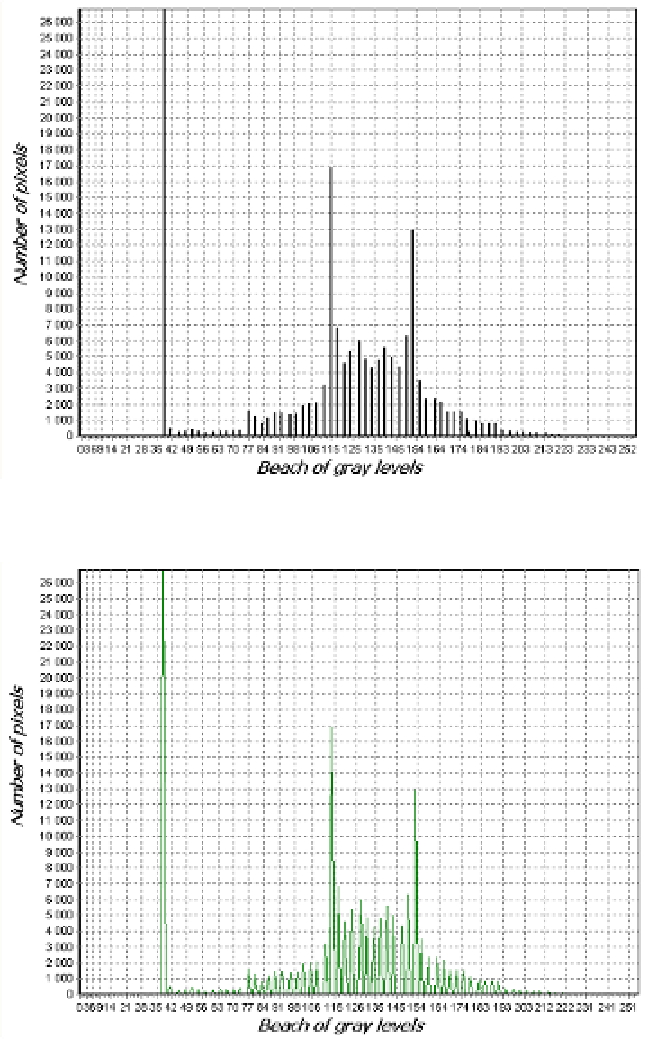
Figure 8.
Texture image histogram obtained by index parameter of Haralick “Mean” on the mangrove
region
Figure 9.
Corresponding signature of the texture image histogram
Table 2 shows the modes and valleys that were used in classification thresholds. It was
obtained on the basis of exploitation of the histogram and the signing of the texture image
which can be seen representations in figures 8 and 9.
For reference, the histogram of the original image and the texture image obtained on the
basis of the radar image taken on the Mount Cameroon region are shown on figures 10 and