Geography Reference
In-Depth Information
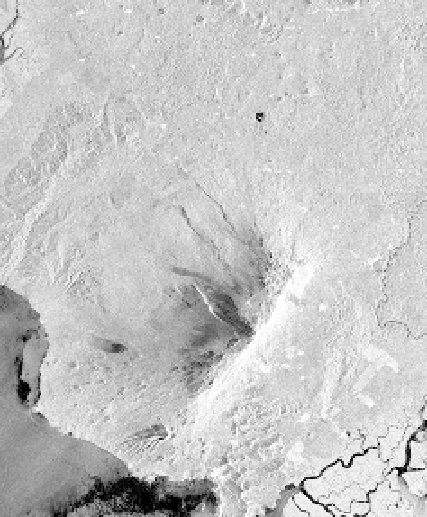
used (Figure 5) is a SAR image, acquired by ERS-1 satellite in C band (
λ
= 5.66cm) with VV
polarization and SLC (Single Look Complex) format. Its spatial resolution is about 25m and
the side of a pixel is 12.5m. This image of 8000 columns and 8269 lines has been acquired on
the 7
th
November 1998.
Due to the lack of a
priori
knowledge on these test sites, various litho-structural maps,
formation plant maps including topographic maps and lithographs at 1: 200 000 of scale
allowed us to identify the various themes.
Figure 5.
Original image of the Mount Cameroun region
5.2. Histogram and thresholds detection
The histogram of original image of the mangrove region (Figure 4) is illustrated on figure 6.
The previous histogram is approximated by the regression curve
which is shown on
Figure 7.
The previous approach, which has the advantage of being simple and fast, is well suited to
images having forms regularly distributed.
The texture image is obtained from the parameter "Mean" in order 3. The calculation was
performed on a window of size 7x7 around each pixel. The choice of this window size is
justified by the fact that we get results like the original image with best representation of
thematic classes. In addition, we found that the larger of window size was wide, there were
more smoothing of the resulting image with absence of fine structure in the image.
The histogram of the texture image is shown in figure 8 and corresponding signature is
shown on the figure 9. The irregularities observed on the histogram of texture images